
USDTHB
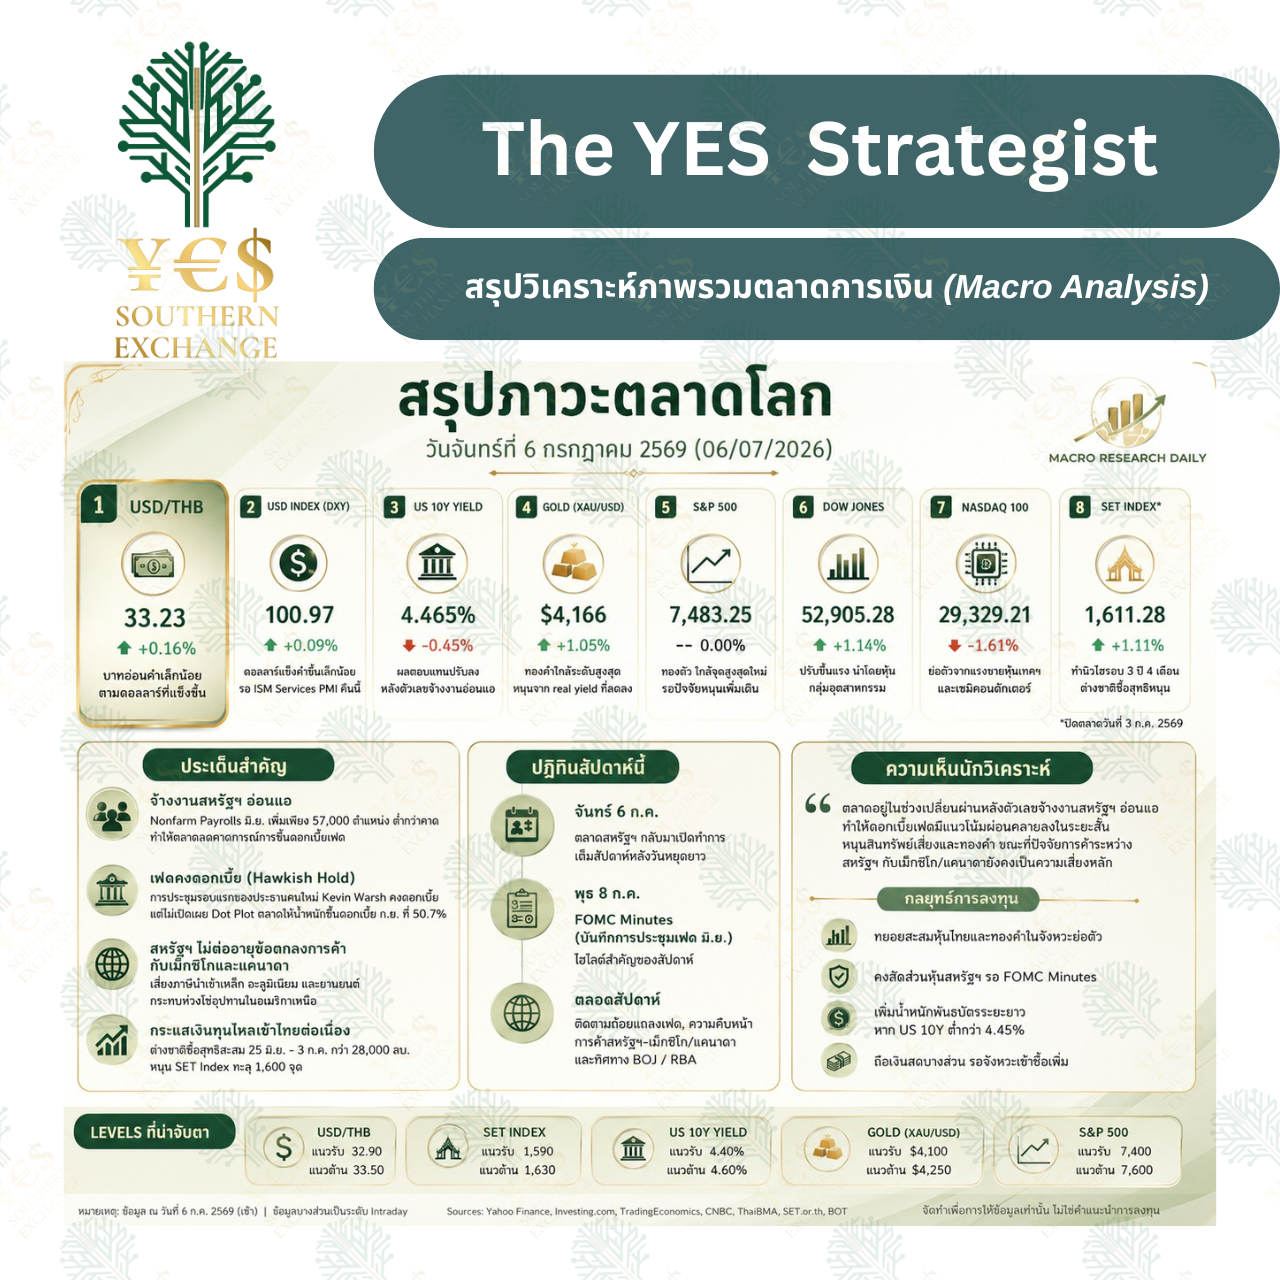
Market Analysis: The DXY index rebounded to 100.95, keeping USDTHB biased towards sideways-to-strengthening. Key focuses today include the S&P Global Services PMI, ISM Services PMI, and Fed Governor Christopher Waller’s speech to gauge US economic strength. Better-than-expected PMI data or hawkish Fed commentary could briefly boost the USD.
ดัชนี DXY รีบาวด์กลับขึ้นสู่ 100.95 ส่งผลให้ USDTHB มีแนวโน้มแข็งค่าถึงทรงตัว โดยวันนี้ตลาดจับตาดัชนี PMI ภาคบริการของ S&P Global, ดัชนี ISM Services PMI และถ้อยแถลงของ Christopher Waller กรรมการ Fed หากตัวเลขออกมาดีกว่าคาดหรือ Fed ส่งสัญญาณคงดอกเบี้ยสูงต่อเนื่อง อาจเป็นปัจจัยหนุน USD ให้แข็งค่าขึ้นในระยะสั้น
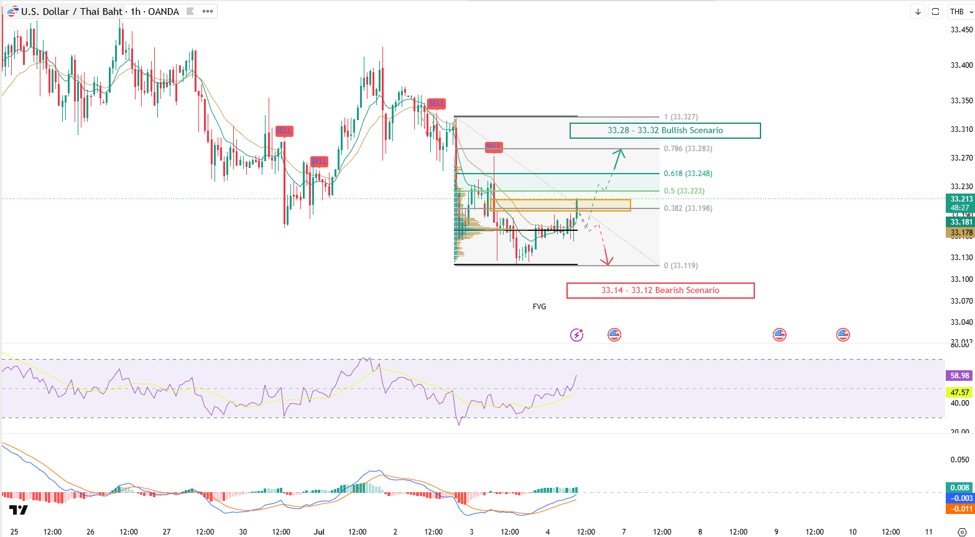
Technical Outlook: The short-term structure is shifting to Sideway Up or Bullish after stabilizing above the Volume Profile POC and short-term EMAs, despite facing Fib 0.382–0.5 resistance (33.20–33.22). Price is testing the FVG zone (33.19–33.22); a clean breakout above 33.22 opens the door to 33.25 and potentially the 33.28–33.32 zone. Conversely, failing to clear 33.22 could trigger a pullback to 33.18–33.16, with a drop below 33.18 risking a retest of 33.14–33.12.
ภาพรวมกราฟเริ่มมีสัญญาณฟื้นตัวจากฐานบริเวณ 33.12 หลังราคาสามารถยืนเหนือโซน Volume Profile POC และกลับขึ้นมายืนเหนือเส้นค่าเฉลี่ยระยะสั้นได้ ทำให้โครงสร้างระยะสั้นเริ่มเปลี่ยนเป็น Sideway Up ถึง Bullish แม้ยังติดแนวต้าน Fibonacci 0.382–0.5 (33.20–33.22) ปัจจุบันราคากำลังทดสอบโซน FVG แถว 33.19–33.22 หากยืนเหนือ 33.22 ได้ มีโอกาสปรับตัวขึ้นต่อสู่ 33.25 และ 33.28–33.32 อย่างไรก็ตาม หากไม่ผ่านแนวต้านอาจย่อตัวลงทดสอบ 33.18–33.16 และหากหลุด 33.18 มีโอกาสลงต่อไปที่ 33.14–33.12
- Support Level (แนวรับ): 33.16 – 33.12
- Target (เป้าหมาย): 33.28 – 33.32
- Stop Loss (คัท): 33.10
EURTHB
Market Analysis: EURTHB is expected to move sideways to slightly stronger. Investors are monitoring Eurozone Retail Sales, PPI, and Sentix Investor Confidence to evaluate the region’s economic recovery. Stronger data will provide short-term support for the Euro, though an opening gain in the Thai stock market this morning could exert minor downward pressure.
EURTHB มีแนวโน้มเคลื่อนไหวทรงตัวถึงแข็งค่าเล็กน้อย โดยตลาดจับตา Eurozone Retail Sales, PPI และ Sentix Investor Confidence เพื่อประเมินการฟื้นตัวของยูโรโซน หากข้อมูลออกมาดีกว่าคาดอาจช่วยหนุน EUR ในระยะสั้น อย่างไรก็ตาม หากตลาดหุ้นไทยช่วงเช้าเปิดบวกมีโอกาสกดดัน EURTHB เพิ่มเติมได้
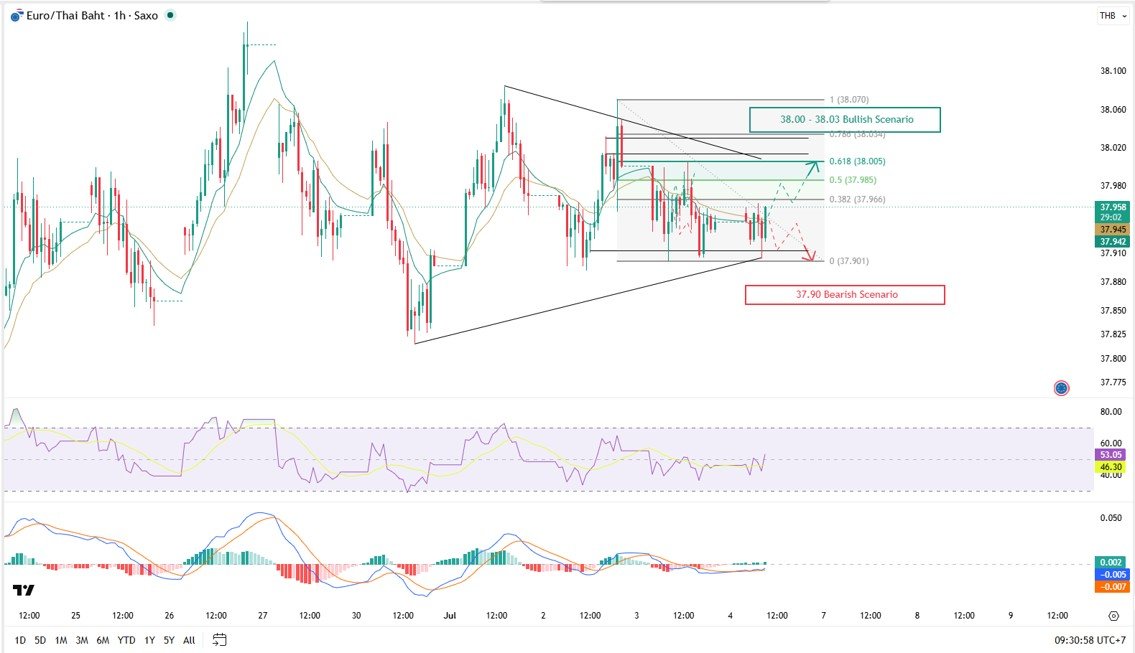
Technical Outlook: The price is consolidating within a Symmetrical Triangle framework, waiting for a clear breakout. Currently flirting with the Fib 0.382 level (37.97), a sustained move above this point would be bullish, targeting 38.00–38.03. On the risk side, the MACD has crossed above its Signal line into positive territory, but if RSI drops below 50 and MACD flips negative, the price could break the 37.94 support and slide down to test 37.90.
ภาพรวมยังอยู่ในลักษณะ Sideway ถึง Sideway Up โดยราคากำลังเคลื่อนไหวภายในกรอบ Symmetrical Triangle เพื่อสะสมกำลังรอเลือกทิศทาง ปัจจุบันราคากำลังเคลื่อนไหวใกล้โซน Fibonacci 0.382 (37.97) หากยืนเหนือบริเวณนี้ได้ จะเป็นสัญญาณบวกที่เพิ่มโอกาสให้ราคาเดินหน้าทดสอบ 38.00–38.03 ด้าน MACD เริ่มตัดขึ้นเหนือเส้น Signal แต่หาก RSI พลิกกลับมาต่ำกว่า 50 และ MACD พลิกเป็นลบ จะเพิ่มโอกาสที่ราคาหลุดแนวรับ 37.94 และลงทดสอบ 37.90 อีกครั้ง
- Support Level (แนวรับ): 37.94 – 37.90
- Target (เป้าหมาย): 38.00 – 38.03
- Stop Loss (คัท): 37.88
GBPTHB
Market Analysis: GBPTHB looks poised for a sideways trend. Market participants are keeping tabs on the UK Construction PMI, New Car Registrations, and a speech by BoE MPC member Catherine Mann. Upbeat economic readings or hawkish rhetoric from the BoE could lift the Pound, whereas a positive start in the Thai equity market may cap gains.
GBPTHB มีแนวโน้มเคลื่อนไหวทรงตัว โดยตลาดจับตา Construction PMI, ยอดจดทะเบียนรถยนต์ใหม่ของสหราชอาณาจักร รวมถึงถ้อยแถลงของ Catherine Mann กรรมการ BoE เพื่อประเมินแนวโน้มเศรษฐกิจและนโยบายการเงิน หากข้อมูลออกมาดีกว่าคาดหรือ BoE ส่งสัญญาณ Hawkish อาจช่วยหนุน GBP ในระยะสั้น แต่หากตลาดหุ้นไทยช่วงเช้าเปิดบวกอาจเป็นปัจจัยกดดันเพิ่มเติม
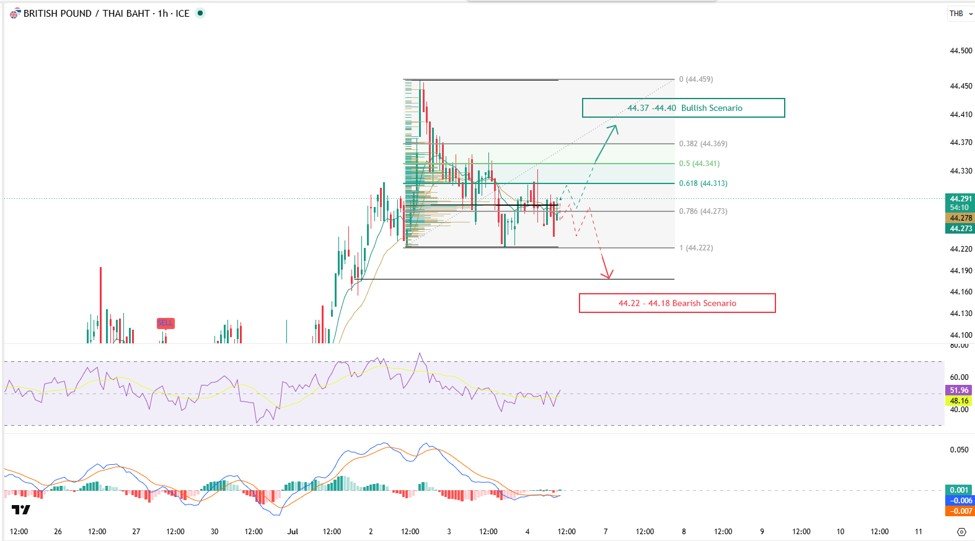
Technical Outlook: The price is moving sideways, successfully holding above the vital support base of 44.27–44.22 without violating recent lows, indicating that buyers are defending this territory. However, overhead resistance from the previous High and Volume Profile limits immediate upside. Clearing the 44.31–44.34 ceiling is essential to challenge 44.37–44.40; otherwise, a rejection or a breakdown below 44.27 could pull the pair back toward 44.22–44.18.
ภาพรวมเคลื่อนไหวในลักษณะ Sideway หลังราคายังคงแกว่งตัวเหนือฐานสำคัญบริเวณ 44.27–44.22 และยังไม่หลุด Low ล่าสุด ทำให้แรงซื้อยังคงพยายามประคองราคาไว้ แม้ระยะสั้นจะยังติดแนวต้านจาก High เดิมและบริเวณ Volume Profile ด้านบน หากราคาสามารถยืนเหนือโซน 44.31–44.34 ได้ จะมีโอกาสกลับขึ้นไปทดสอบแนวต้าน 44.37–44.40 แต่หากไม่สามารถยืนได้หรือหลุด 44.27 มีโอกาสอ่อนค่าลงทดสอบบริเวณ 44.22–44.18 อีกครั้ง
- Support Level (แนวรับ): 44.27 – 44.22
- Target (เป้าหมาย): 44.37 – 44.40
- Stop Loss (คัท): 44.20
AUDTHB
Market Analysis: AUDTHB is showing a sideways-to-weakening bias following soft data from Australia, including a contraction in the Melbourne Institute Inflation Gauge (-0.4%) and a decline in ANZ Job Advertisements (-0.2%). These indicators reflect slowing inflation and a softening labor market, fueling RBA rate-cut expectations and denting the Aussie. A green morning for Thai stocks could add further pressure.
AUDTHB มีแนวโน้มเคลื่อนไหวทรงตัวถึงอ่อนค่าเล็กน้อย หลังตัวชี้วัดอัตราเงินเฟ้อจาก Melbourne Institute เดือนมิถุนายนหดตัว -0.4% และยอดโฆษณางานของ ANZ ลดลง -0.2% สะท้อนเงินเฟ้อและตลาดแรงงานที่ชะลอตัว ซึ่งเพิ่มความคาดหวังว่า RBA จะผ่อนคลายนโยบายการเงินและกดดันค่าเงิน AUD ขณะที่ตลาดหุ้นไทยช่วงเช้าหากเปิดบวกก็อาจกดดันคู่เงินนี้เพิ่มเติมได้
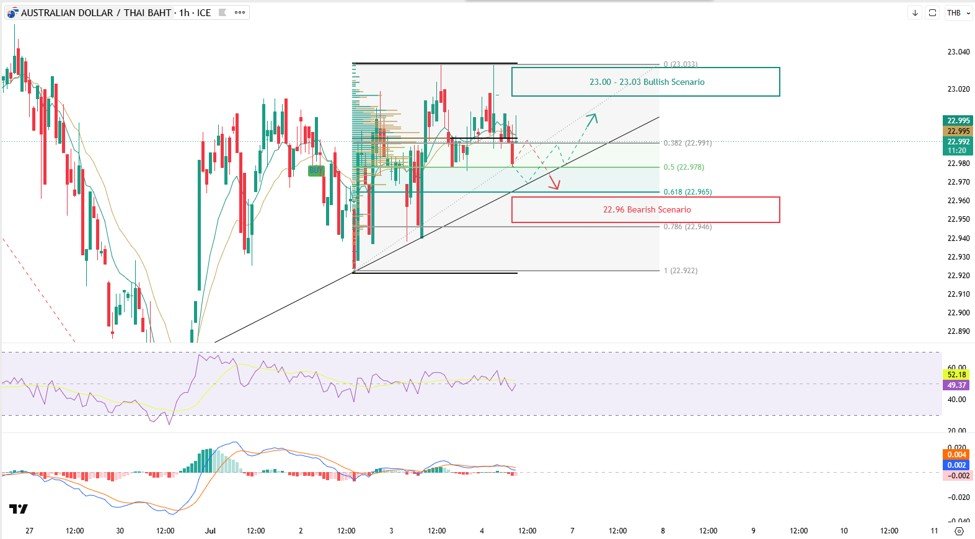
Technical Outlook: The underlying structure remains intact as the price stays above its ascending trendline and the key support zone of 22.97–22.96 (Fib 50–61.8 + Volume Profile). Momentum indicators (RSI at 50, flat MACD) point to a neutral state. Sustaining above 22.97–22.96 keeps a rebound toward 23.00–23.03 on the table, while failing to cross the heavy overhead resistance at 22.99 or breaking below 22.96 could see the price drop back to 22.94.
ภาพรวมยังอยู่ในลักษณะ Sideway ถึง Sideway Up หลังราคาสามารถยืนเหนือเส้น Trendline ขาขึ้นและโซนรับสำคัญบริเวณ 22.97–22.96 (Fib 50–61.8 และ Volume Profile) ได้ แม้ยังไม่ผ่านแนวต้าน 22.99 ชัดเจน ด้าน RSI และ MACD สะท้อนว่าโมเมนตัมยังเป็นกลางเพื่อรอปัจจัยใหม่ หากราคาสามารถยืนเหนือโซน 22.97–22.96 ได้ มีโอกาสรีบาวด์กลับขึ้นไปทดสอบแนวต้าน 23.00–23.03 แต่หากโดนแรงขายบริเวณ 22.99 กดดันจนหลุดแนวรับ 22.96 มีโอกาสอ่อนค่าลงทดสอบโซน 22.94
- Support Level (แนวรับ): 22.97 – 22.96
- Target (เป้าหมาย): 23.00 – 23.03
- Stop Loss (คัท): 22.95
CHFTHB
Market Analysis: Supported by a VIX index at 16.15, CHFTHB is leaning sideways to slightly firmer. Market participants are looking ahead to Switzerland’s Unemployment Rate to check labor market conditions; a healthy reading could offer short-term support to the Swiss Franc. Safe-haven flows and impending US economic data continue to guide broader CHF direction.
ดัชนี VIX ที่ระดับ 16.15 ทำให้ CHFTHB มีแนวโน้มทรงตัวถึงแข็งค่าเล็กน้อย โดยตลาดจับตาอัตราการว่างงานของสวิตเซอร์แลนด์เพื่อประเมินความแข็งแกร่งของตลาดแรงงาน หากตัวเลขออกมาดีอาจช่วยหนุนค่าเงินฟรังก์สวิสในระยะสั้น อย่างไรก็ตาม ความเชื่อมั่นต่อสินทรัพย์ปลอดภัย (Safe Haven) และข้อมูลเศรษฐกิจสหรัฐฯ ยังคงเป็นปัจจัยสำคัญหลัก
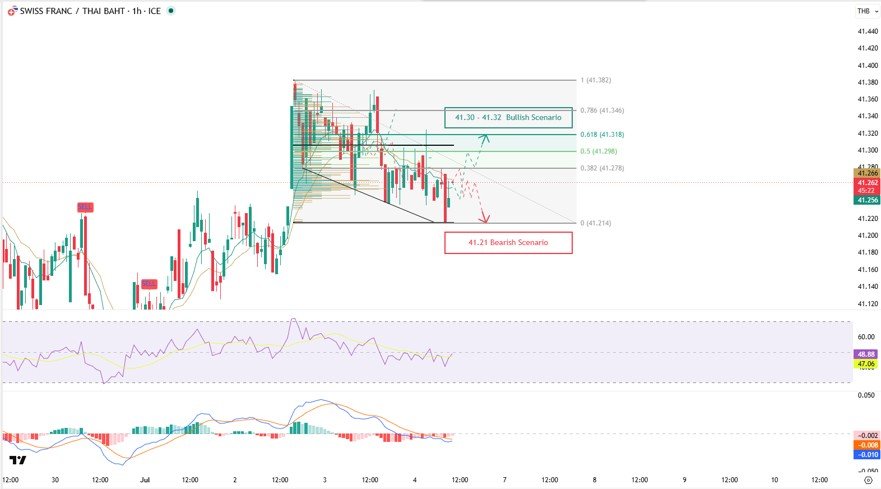
Technical Outlook: The price is caught in a tight consolidation range, struggling to establish a clear directional bias. It remains supported above 41.26–41.21 but is capped by immediate resistance at 41.28. Momentum is lackluster with the RSI hovering at 48 and MACD stuck below zero. If buyers can push the price above 41.30, it can target 41.32–41.34. However, with indicators still weak, failure to clear resistance could lead to a breakdown under 41.21 to retest range lows.
ภาพรวมยังคงเคลื่อนไหวในลักษณะ Sideway ภายในกรอบสะสมและยังไม่เลือกทิศทางชัดเจน โดยราคายังยืนเหนือแนวรับบริเวณ 41.26–41.21 แต่ยังติดแนวต้านที่ 41.28 ด้าน RSI อยู่ที่ระดับ 48 และ MACD ยังอยู่ต่ำกว่าเส้นศูนย์ สะท้อนว่าแรงซื้อยังไม่แข็งแรงพอ หากราคาสามารถยืนเหนือโซน 41.30 ได้ จะมีโอกาสขึ้นไปทดสอบแนวต้านที่ 41.32–41.34 แต่หากราคาพลิกหลุดแนวรับ 41.26 และ 41.21 มีโอกาสปรับตัวลงต่อเพื่อทดสอบ Low เดิมของกรอบสะสม
- Support Level (แนวรับ): 41.26 – 41.21
- Target (เป้าหมาย): 41.30 – 41.32
- Stop Loss (คัท): 41.20
https://th.tradingview.com/u/Soponwit_AISA_MSc/