
Summary :
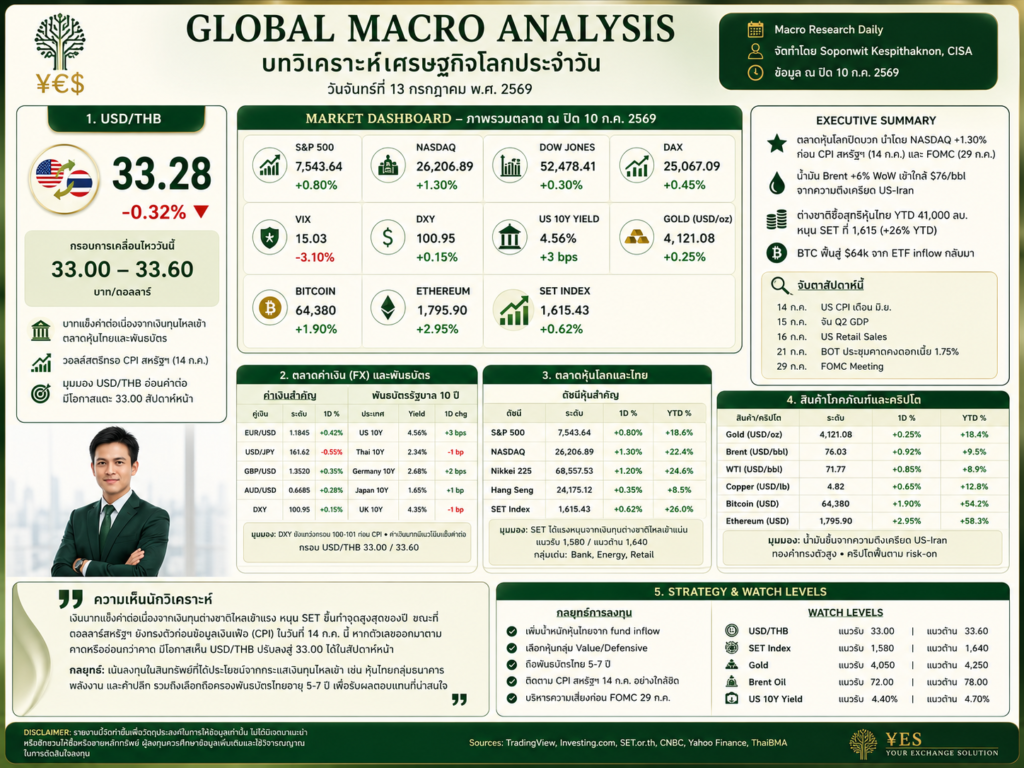
Global equity markets concluded the week on a positive note, with the S&P 500 achieving a fresh record high at 7,543.64. The decline of the VIX index to 15.03 reflects a prevailing risk-on sentiment as market participants position ahead of the upcoming US CPI release (July 14) and the FOMC meeting (July 29). However, geopolitical frictions—specifically growing US-Iran tensions—drove Brent crude up by +6% Week-on-Week (WoW). This spike in energy prices presents a renewed upside risk to global inflation and requires close monitoring.
USDTHB
Market Analysis: The DXY index rebounded to 101.21, prompting USDTHB to trade in a steady-to-bullish range as investors adjust positions early in the week. Today, the market is focusing on FOMC member speeches, the OPEC meeting, and the 3- and 6-month US Treasury bill auctions to gauge bond yield and greenback directions. Meanwhile, the majority of investors remain on the sidelines awaiting Tuesday night’s US CPI and Core CPI releases, which will be the primary short-term catalyst for USDTHB.
However, catch the eyes on CPI factors as the investor downward forecast 4.2 to 3.8, leaving USDTHB vulnerable to technical selling with a tendency to trade within a weaker bias cause by CPI this Tuesday.
ดัชนี DXY รีบาวด์ขึ้นสู่ระดับ 101.21 ส่งผลให้ USDTHB มีแนวโน้มเคลื่อนไหวทรงตัวถึงแข็งค่า นักลงทุนเริ่มปรับสถานะเพื่อรอตัวเลขเงินเฟ้อสหรัฐฯ (CPI) โดยวันนี้ตลาดติดตามถ้อยแถลงของสมาชิก FOMC, การประชุม OPEC และการประมูลตั๋วเงินคลังสหรัฐฯ เพื่อประเมินทิศทาง Yield และค่าเงินดอลลาร์ ขณะที่นักลงทุนส่วนใหญ่ยังรอดู CPI และ Core CPI ในคืนวันอังคาร ซึ่งจะเป็นปัจจัยสำคัญกำหนดทิศทาง USDTHB ระยะสั้น
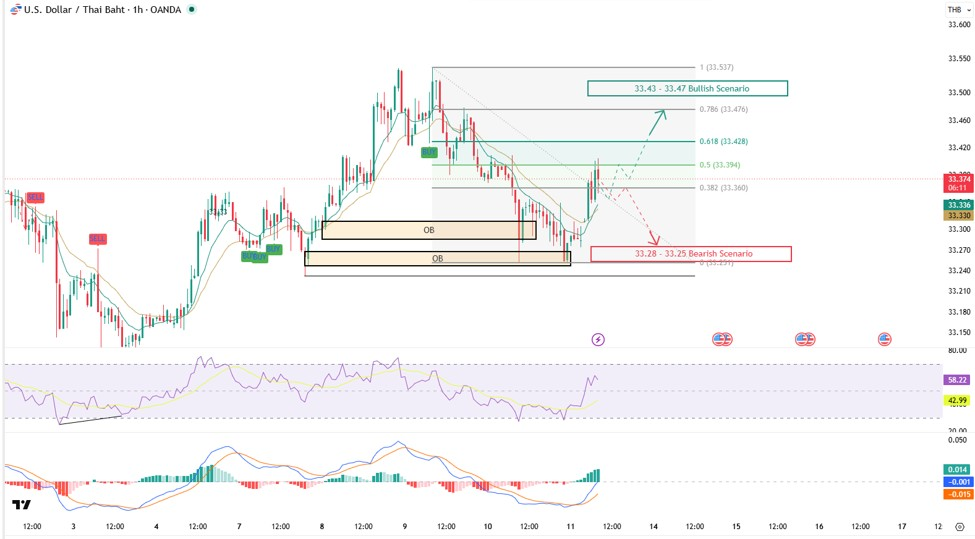
Technical Outlook: The chart remains in a recovery phase after bouncing from the Order Block (OB) zone at 33.25–33.26 and reclaiming the EMA line. However, the price is facing selling pressure at the Fibonacci 0.5 resistance (33.39). The MACD has crossed above the signal line with a positive histogram, indicating recovering buying momentum. If the price sustains above 33.39, it could retest 33.43 and 33.47. Conversely, failure to clear 33.39 may trigger profit-taking toward 33.33–33.28. A break below 33.28 would weaken the recovery outlook, risking a drop to the 33.25 base. A positive opening in the Thai stock market also presents a downside risk.
ราคาดีดตัวขึ้นจากโซน Order Block (OB) 33.25–33.26 และกลับมายืนเหนือเส้น EMA ได้ แต่กำลังเผชิญแรงขายที่แนวต้าน Fibonacci 0.5 (33.39) ด้าน MACD ตัดขึ้นเหนือ Signal Line และ Histogram เป็นบวกสะท้อนแรงซื้อที่เริ่มฟื้นตัว หากผ่าน 33.39 ได้มีโอกาสทดสอบ 33.43 และ 33.47 อย่างไรก็ตาม หากไม่ผ่านอาจเกิดแรงขายทำกำไรลงมาโซน 33.33–33.28 หากหลุด 33.28 ภาพการฟื้นตัวจะอ่อนแรงและอาจลงไปทดสอบฐาน 33.25 อีกครั้ง อีกทั้งต้องระวังแรงกดดันเพิ่มเติมหากตลาดหุ้นไทยเปิดบวก
- Support / แนวรับ: 33.33 – 33.28
- Resistance / แนวต้าน: 33.39
- Target / เป้าหมาย: 33.43 – 33.47
- Cut Loss / จุดตัดขาดทุน: 33.27
EURTHB
Market Analysis: With no major direct economic data for the EUR today, the rebound in the DXY is pushing USDTHB higher, providing indirect support for EURTHB to trade in a steady-to-bullish range. Markets are tracking the German Bundesbank Monthly Report, Germany’s Current Account, and German government bond auctions. Ultimately, investors are awaiting Tuesday’s US inflation data, which will heavily dictate the trajectory of the dollar and EURTHB.
ปัจจัยพื้นฐานยุโรป ไม่มีตัวเลขเศรษฐกิจสำคัญที่ส่งผลต่อ EUR โดยตรง แต่การรีบาวด์ของ DXY ที่หนุน USDTHB แข็งค่า ช่วยพยุงให้ EURTHB ทรงตัวถึงแข็งค่าในระยะสั้น ตลาดติดตามรายงาน Bundesbank, ดุลบัญชีเดินสะพัด และการประมูลพันธบัตรเยอรมนี เพื่อประเมินแนวโน้มเศรษฐกิจ โดยภาพหลักนักลงทุนยังคงรอตัวเลข CPI สหรัฐฯ ในคืนวันอังคารที่จะเป็นตัวกำหนดทิศทางของคู่เงินนี้
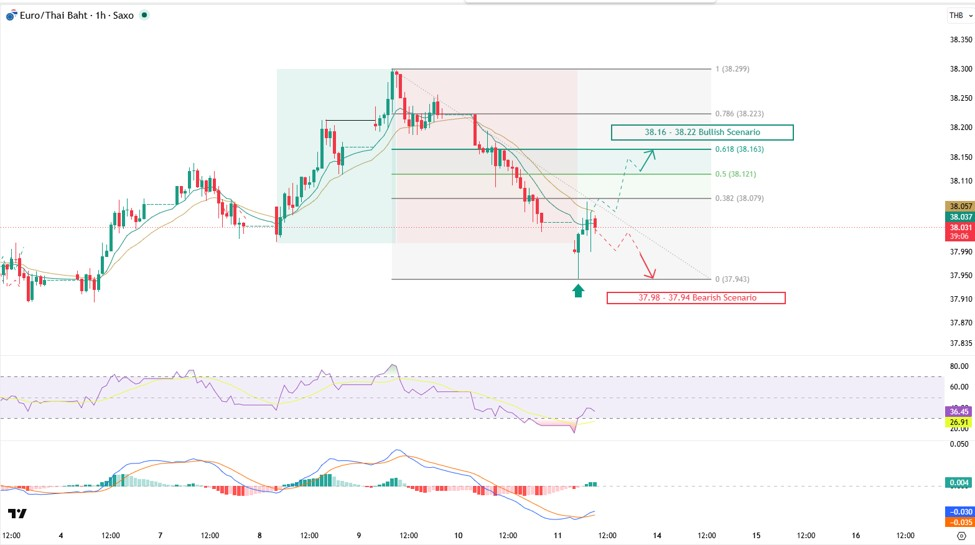
Technical Outlook: EURTHB is rebounding from a key Fibonacci 0% support (37.94), though it remains below the EMA, keeping the primary trend bearish. The RSI is around 36, recovering from Oversold levels, while the MACD curves upward with a shrinking histogram, indicating waning bearish momentum. Sustaining above 38.08–38.12 would confirm further buying interest toward 38.16–38.22. Failure to clear 38.08–38.12 could invite selling pressure, driving the price back to 37.98–37.94. A strong Thai stock market open could add downward pressure.
ภาพรวมกราฟ EURTHB ราคาดีดตัวจากแนวรับสำคัญ Fibonacci 0% (37.94) แต่ยังไม่กลับเป็นขาขึ้นเนื่องจากอยู่ใต้เส้น EMA ด้าน RSI ที่ 36 เริ่มฟื้นจากเขต Oversold และ MACD เข้าใกล้ Signal Line พร้อม Histogram หดตัว สะท้อนโมเมนตัมฝั่งขายที่อ่อนแรง หากยืนเหนือ 38.08–38.12 ได้ จะยืนยันแรงซื้อเพื่อทดสอบ 38.16–38.22 แต่หากไม่ผ่าน มีโอกาสถูกแรงขายกดลงมาทดสอบแนวรับเดิม 37.98–37.94 อีกครั้ง รวมถึงต้องระวังแรงกดดันจากตลาดหุ้นไทย
Support / แนวรับ: 37.98 – 37.94
Resistance / แนวต้าน: 38.08 – 38.12
Target / เป้าหมาย: 38.16 – 38.22
Cut Loss / จุดตัดขาดทุน: 37.97
GBPTHB
Market Analysis: GBPTHB is expected to trade in a steady-to-slightly-bullish range. With no major UK economic data scheduled for today, the market is primarily focusing on USD movements. The majority of investors are awaiting the US CPI and Core CPI releases on Tuesday night, which could significantly impact the short-term direction of the pair.
บทวิเคราะห์ตลาด: แนวโน้มเคลื่อนไหวทรงตัวถึงแข็งค่าเล็กน้อย เนื่องจากวันนี้สหราชอาณาจักรไม่มีการประกาศตัวเลขเศรษฐกิจสำคัญ ตลาดจึงให้น้ำหนักกับการเคลื่อนไหวของ USD ขณะที่นักลงทุนส่วนใหญ่ยังรอการประกาศ CPI และ Core CPI ของสหรัฐฯ ในคืนวันอังคาร ซึ่งอาจส่งผลต่อทิศทาง GBPTHB ในระยะสั้น
บทวิเคราะห์ตลาด:
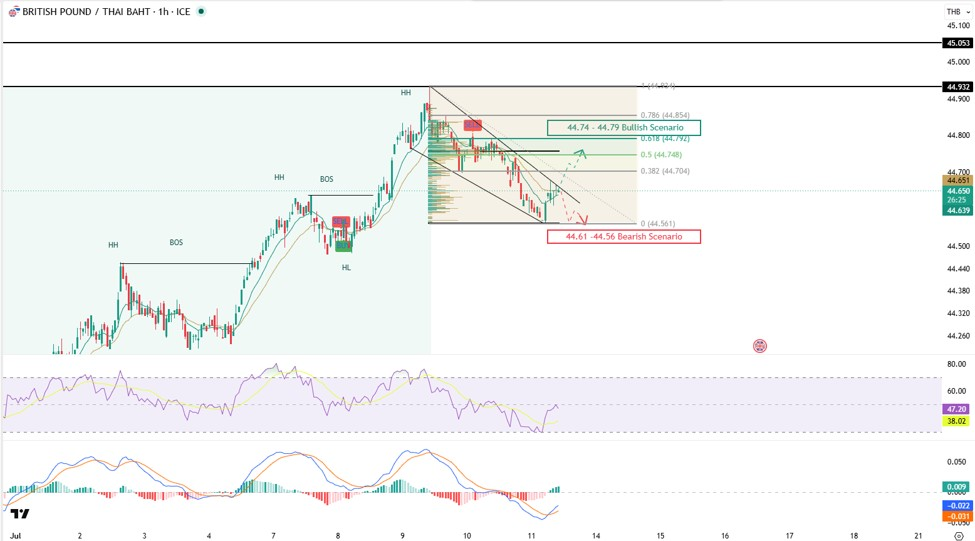
Technical Outlook: Short-term Downtrend (Falling Channel). The short-term overview remains in a downtrend. Although the price has entered a consolidation phase within a Falling Channel after declining from its peak, the primary structure remains intact as it holds above the 44.56 support and continues to form Higher Lows (HL). A firm break above the 44.70 zone could trigger a recovery to test the 44.74–44.79 resistance. However, the price faces continued downward pressure within the channel and potential profit-taking near resistance. With the RSI below 50 and the MACD just beginning to show positive signals, failure to clear 44.70 or a drop below 44.61 could lead to a retest of 44.56. Additionally, a positive opening in the Thai stock market could exert further downward pressure.
ในทางเทคนิค: (แนวโน้มขาลงระยะสั้น) ภาพรวมระยะสั้นยังอยู่ในแนวโน้มขาลง แม้ราคาพักฐานในกรอบ Falling Channel หลังปรับตัวลงจากจุดสูงสุด แต่โครงสร้างหลักยังไม่เสีย เนื่องจากยืนเหนือแนวรับ 44.56 และสร้าง Higher Low (HL) ได้ หากยืนเหนือ 44.70 อย่างมั่นคง มีโอกาสฟื้นตัวทดสอบ 44.74–44.79 อย่างไรก็ตาม ราคายังเผชิญแรงกดดันใน Falling Channel ทำให้มีโอกาสถูกขายทำกำไรเมื่อใกล้แนวต้าน ประกอบกับ RSI ยังต่ำกว่า 50 และ MACD เพิ่งเริ่มส่งสัญญาณบวก หากไม่ผ่าน 44.70 หรือหลุด 44.61 อาจอ่อนค่าลงทดสอบ 44.56 อีกครั้ง นอกจากนี้ หากตลาดหุ้นไทยเปิดบวกอาจเป็นปัจจัยกดดัน GBPTHB เพิ่มเติม
Risk Factors: The pair faces potential downward pressure from capital outflows as market participants actively position ahead of Tuesday’s US CPI release. There is a strong likelihood of capital being reallocated out of European currencies, including the GBP, to speculate on a potentially stronger US Dollar (USD Rebound Pricing-in). This pre-data fund flow realignment could temporarily weaken the Pound and limit the upside for GBPTHB during the daytime trading sessions.
- Support / แนวรับ: 44.61 – 44.56
- Resistance / แนวต้าน: 44.70
- Target / เป้าหมาย: 44.74 – 44.79
- Cut Loss / จุดตัดขาดทุน: 44.54
AUDTHB
Market Analysis: AUDTHB is expected to trade within a consolidated range due to a lack of major Australian economic data today. The AUD’s direction will be largely driven by broader Asian market sentiment and US Dollar dynamics. The market is in a holding pattern ahead of the highly anticipated US CPI and Core CPI data on Tuesday night, which may introduce short-term volatility.
แนวโน้มเคลื่อนไหวในกรอบทรงตัว วันนี้ออสเตรเลียไม่มีตัวเลขเศรษฐกิจสำคัญ ทิศทาง AUD จึงอิงตามบรรยากาศตลาดเอเชียและค่าเงินดอลลาร์สหรัฐฯ นักลงทุนส่วนใหญ่ชะลอการลงทุนเพื่อรอตัวเลข CPI และ Core CPI ของสหรัฐฯ คืนวันอังคาร ซึ่งจะส่งผลให้ AUDTHB มีความผันผวนระยะสั้นตรเลีย
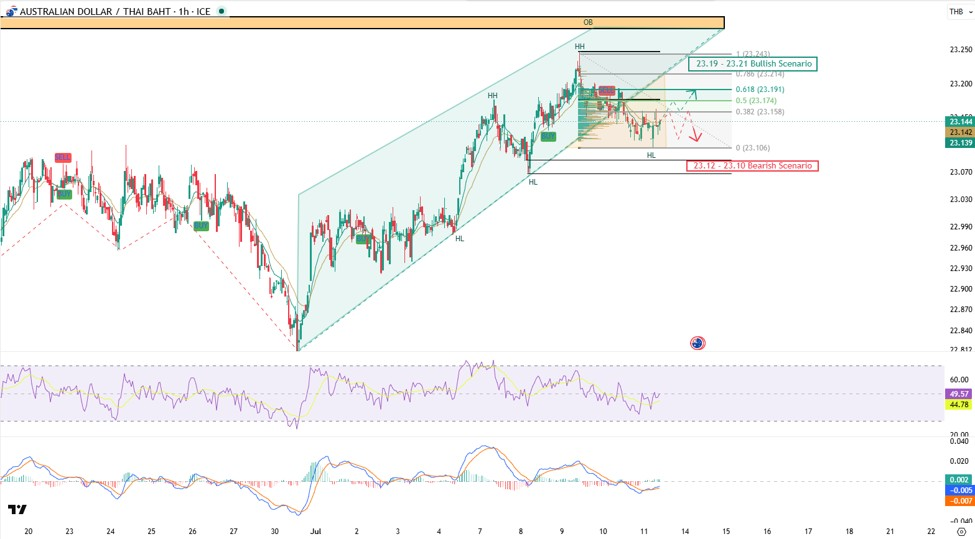
Technical Outlook: Sideway / Short-term Recovery. The chart is moving sideways after consolidating around 23.10–23.11. Although capped by the Fibonacci 0.382 resistance at 23.15, the structure maintains a Higher Low (HL) pattern, preserving the recovery outlook. A breakout above 23.15–23.17 opens the upside toward 23.19–23.21. However, if the 23.15 resistance holds, short-term profit-taking could force a retest of the 23.12–23.10 support. Additional downward pressure may stem from a positive Thai equity market open.
ระยะสั้นราคายังพักฐานบริเวณ 23.10–23.11 แม้ติดแนวต้าน Fibonacci 0.382 (23.15) แต่โครงสร้างหลักยังรักษารูปแบบ Higher Low (HL) ทำให้มีโอกาสฟื้นตัวต่อ หากผ่าน 23.15–23.17 ได้จะเปิด Upside ไปที่ 23.19–23.21 ในทางกลับกัน หากไม่ผ่าน 23.15 อาจเกิดแรงขายทำกำไรย่อตัวลงทดสอบ 23.12–23.10 อีกครั้ง รวมถึงต้องจับตาทิศทางตลาดหุ้นไทยที่อาจเป็นปัจจัยกดดัน
- Support / แนวรับ: 23.12 – 23.10
- Resistance / แนวต้าน: 23.15 – 23.17
- Target / เป้าหมาย: 23.19 – 23.21
- Cut Loss / จุดตัดขาดทุน: 23.09
CHFTHB
Market Analysis : CHFTHB is expected to trade range-bound with a slight bullish bias. With no major Swiss economic data scheduled today, the CHF is likely to follow global market sentiment, safe-haven demand, and short-term USD dynamics. Markets are holding back on major investments ahead of tomorrow’s US CPI release, which could heavily influence expectations for Fed monetary policy and inject short-term volatility into both the USD and CHF.
บทวิเคราะห์ตลาด : แนวโน้มเคลื่อนไหวในกรอบถึงแข็งค่าเล็กน้อย เนื่องจากสวิตเซอร์แลนด์ไม่มีการประกาศตัวเลขเศรษฐกิจสำคัญ ค่าเงิน CHF จึงมีแนวโน้มเคลื่อนไหวตามบรรยากาศการลงทุนทั่วโลก ความต้องการสินทรัพย์ปลอดภัย (Safe Haven) และทิศทาง USD ระยะสั้น ตลาดยังชะลอการลงทุนเพื่อรอตัวเลข CPI ของสหรัฐฯ ในวันพรุ่งนี้ ซึ่งอาจส่งผลต่อคาดการณ์นโยบายการเงินของ Fed และสร้างความผันผวนให้ทั้ง USD และ CHF
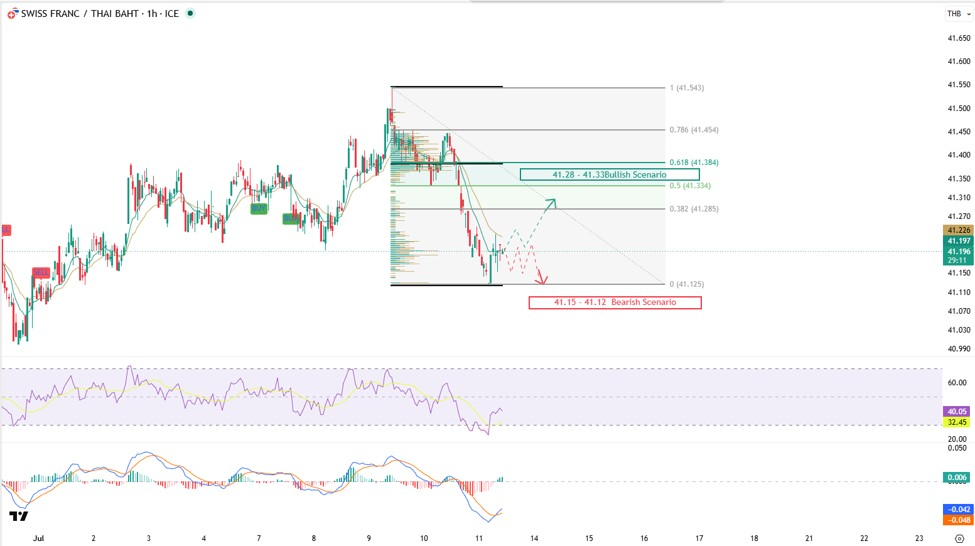
Technical Outlook: Sideway to Bearish. The chart remains in a Sideway to Bearish trend after breaking below its accumulation zone and failing to reclaim key resistance. Although buying interest has recently emerged around the 41.15 support, the short-term structure maintains a Lower High and Lower Low pattern, keeping sellers in control. Reclaiming the 41.24 zone could spark a rebound toward 41.28–41.33. However, with the price moving below the EMA and maintaining a short-term bearish structure, selling pressure is likely to return upon retesting resistance. The RSI also remains below 50. If the price fails to break above 41.24, it risks weakening toward 41.15–41.12. A strong Thai stock market open could add further downside risk.
ในทางเทคนิค: แกว่งตัวออกข้างถึงขาลง ภาพรวมกราฟยังอยู่ในแนวโน้ม Sideway to Bearish หลังหลุดกรอบสะสมและยังไม่สามารถกลับไปยืนเหนือแนวต้านสำคัญได้ แม้เริ่มมีแรงซื้อกลับที่แนวรับ 41.15 แต่โครงสร้างระยะสั้นยังทำ Lower High และ Lower Low ทำให้ฝั่งขายยังได้เปรียบ หากกลับมายืนเหนือโซน 41.24 ได้ มีโอกาสรีบาวด์ทดสอบ 41.28–41.33 อย่างไรก็ตาม ราคายังอยู่ใต้เส้น EMA และมีโครงสร้างขาลงระยะสั้น จึงมีโอกาสเผชิญแรงขายเมื่อรีบาวด์ ประกอบกับ RSI ต่ำกว่า 50 หากไม่ผ่าน 41.24 อาจอ่อนค่าลงทดสอบ 41.15–41.12 อีกครั้ง รวมถึงต้องระวังแรงกดดันเพิ่มเติมหากตลาดหุ้นไทยเปิดบวก
Risk Factors:
- Support / แนวรับ: 41.15 – 41.12
- Resistance / แนวต้าน: 41.24
- Target / เป้าหมาย: 41.28 – 41.33
- Cut Loss / จุดตัดขาดทุน: 41.11