
USDTHB
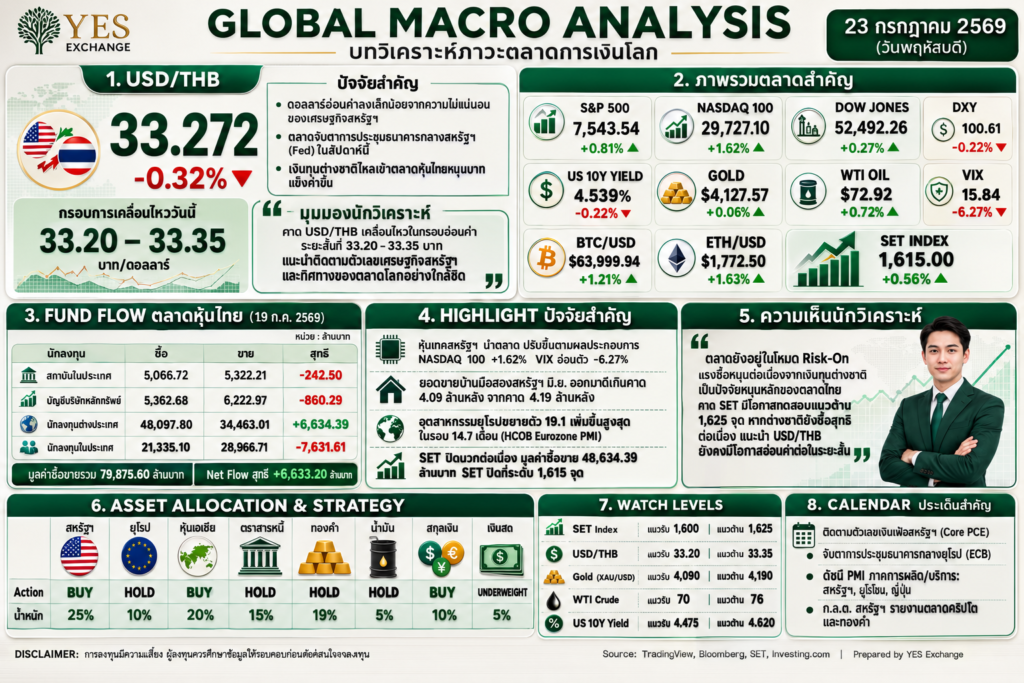
Market Analysis: The USDTHB is expected to trade range-bound to slightly appreciating. The DXY sits at 101.060 while rising oil prices driven by Middle East tensions sustain safe-haven demand for the USD. Market attention today turns to the U.S. Initial Jobless Claims for interest rate and economic cues, alongside the ECB meeting decisions. Lower-than-expected jobless claims could further boost the Dollar, driving short-term gains for USDTHB.
บทวิเคราะห์ตลาด: USDTHB มีแนวโน้มเคลื่อนไหวในกรอบถึงแข็งค่าเล็กน้อย โดยดัชนี DXY อยู่ที่ 101.060 ขณะที่ราคาน้ำมันปรับตัวสูงขึ้นจากความตึงเครียดในตะวันออกกลาง ส่งผลให้แรงซื้อเงินดอลลาร์ในฐานะสินทรัพย์ปลอดภัยยังคงมีอยู่ ในส่วนของวันนี้ ตลาดจับตาการประกาศจำนวนผู้ขอรับสวัสดิการว่างงานครั้งแรกของสหรัฐฯ (Initial Jobless Claims) เพื่อประเมินแนวโน้มเศรษฐกิจและทิศทางอัตราดอกเบี้ยของ Fed รวมถึงผลการประชุมและถ้อยแถลงของ ECB ซึ่งอาจส่งผลต่อการเคลื่อนไหวของดัชนี DXY หากตัวเลขผู้ขอรับสวัสดิการว่างงานออกมาต่ำกว่าคาด จะเป็นปัจจัยหนุนค่าเงินดอลลาร์เพิ่มเติม ส่งผลให้ USDTHB มีโอกาสแข็งค่าต่อในระยะสั้น
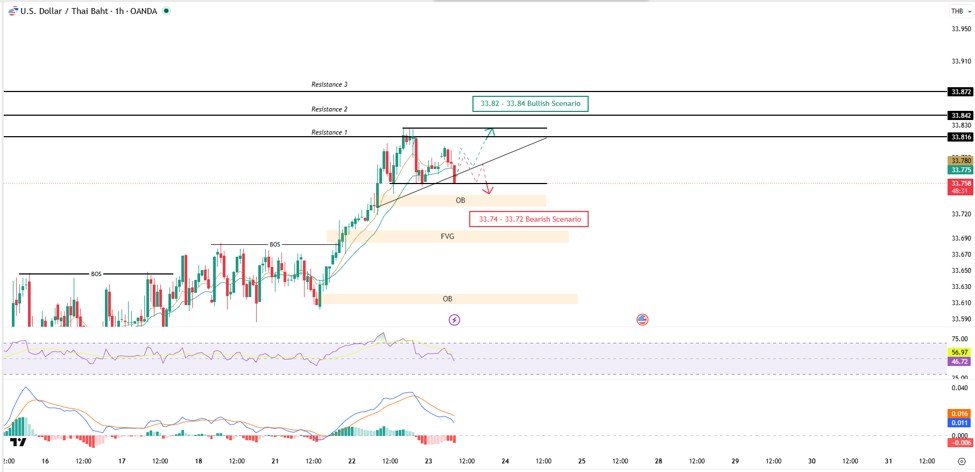
Technical Outlook: The overall technical structure remains Bullish, despite a temporary pullback to test the Up Trend line and short-term support after failing to break 33.80. The primary structure remains intact; if price holds above the trendline and reclaims 33.80, it will likely test the next resistance zone at 33.82 – 33.84. However, weakening momentum on MACD and RSI presents downside risks—a breakdown below 33.74 opens targets at the Order Block (OB) and Fair Value Gap (FVG), while losing 33.72 signals a deeper correction. Additionally, a slightly higher opening in the SET Index driven by energy stocks could offer temporary support to the Baht.
มุมมองทางเทคนิค: ภาพรวมกราฟ USDTHB ยังคงอยู่ในแนวโน้ม Bullish แม้ว่าราคาจะปรับฐานลงมาทดสอบเส้น Up Trend และบริเวณแนวรับระยะสั้น หลังไม่สามารถผ่านแนวต้านที่ 33.80 ได้ อย่างไรก็ตาม โครงสร้างหลักยังไม่เสีย หากราคาสามารถยืนเหนือเส้นแนวโน้มและกลับขึ้นไปยืนเหนือ 33.80 ได้อีกครั้ง จะมีโอกาสขึ้นทดสอบแนวต้านถัดไปที่ 33.82 – 33.84 อย่างไรก็ตาม แม้แนวโน้มหลักยังเป็น Bullish แต่สัญญาณจาก MACD และ RSI บ่งชี้ว่าโมเมนตัมเริ่มอ่อนแรง หากราคาหลุดแนวรับบริเวณ 33.74 จะเพิ่มโอกาสเกิดแรงขายลงสู่โซน Order Block (OB) และ Fair Value Gap (FVG) หากราคาหลุด 33.72 จะเป็นสัญญาณว่าแรงซื้อเริ่มเสียเปรียบ และอาจเห็นการพักฐานลึกมากขึ้น อีกทั้ง SET Index มีแนวโน้มเปิดบวกเล็กน้อย จากแรงซื้อในหุ้นกลุ่มพลังงานตามทิศทางราคาน้ำมัน ซึ่งอาจช่วยพยุงค่าเงินบาทและกดดัน USDTHB ในระยะสั้น
Support Level (แนวรับ): 33.75 – 33.74
Target (เป้าหมาย): 33.82 – 33.84
Stop Loss (คัท): 33.73
EURTHB
Market Analysis: EURTHB is likely to trade within a range with a bias toward short-term appreciation. A decline in the DXY to 101.060 relieves pressure on the Euro, while markets anticipate the ECB to hold interest rates steady. Investors are closely monitoring the ECB President’s statements for future monetary policy signals—dovish remarks could pressure EURTHB lower, whereas a hawkish tone would provide short-term support to the Euro.
บทวิเคราะห์ตลาด: EURTHB มีแนวโน้มเคลื่อนไหวในกรอบถึงแข็งค่าในระยะสั้น โดยดัชนี DXY ปรับตัวลงสู่ 101.060 ช่วยลดแรงกดดันต่อค่าเงินยูโรในระยะสั้น ขณะที่ตลาดคาดว่า ECB จะคงอัตราดอกเบี้ย นักลงทุนจึงจับตาถ้อยแถลงของประธาน ECB เพื่อประเมินแนวโน้มนโยบายการเงินในระยะถัดไป หาก ECB ส่งสัญญาณ Dovish อาจกดดันค่าเงินยูโรและ EURTHB ให้อ่อนค่าลง ขณะที่ท่าที Hawkish มากกว่าคาดอาจช่วยหนุนค่าเงินยูโรและ EURTHB ให้แข็งค่าขึ้นในระยะสั้น
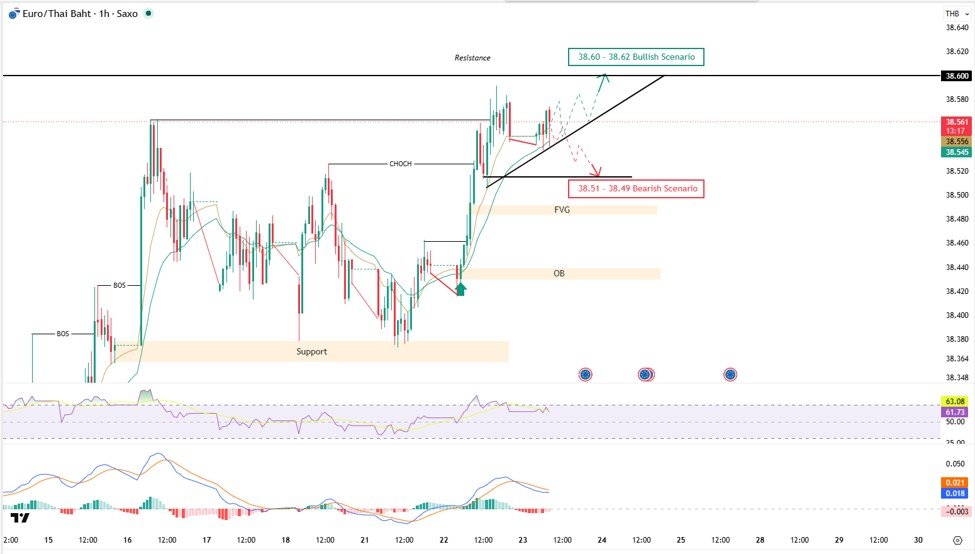
Technical Outlook: The short-term chart maintains a Bullish structure, forming continuous Higher Highs (HH) and Higher Lows (HL) while holding above both EMA lines. Although price action is consolidating near key resistance at 38.57, the uptrend remains intact; a sustained move above the trendline and a breakout over 38.57 could trigger an extension toward 38.60 – 38.62. Conversely, loss of MACD momentum at major resistance increases profit-taking risks down toward the FVG zone at 38.51 and 38.49, with a positive SET Index open adding potential resistance to EURTHB.
มุมมองทางเทคนิค: ภาพรวมกราฟ EURTHB ในระยะสั้น ยังคงอยู่ในแนวโน้ม Bullish หลังราคาสามารถสร้าง Higher High (HH) และ Higher Low (HL) ต่อเนื่อง พร้อมยืนเหนือเส้นค่าเฉลี่ย EMA ทั้งสองเส้น แม้ว่าราคาจะเริ่มชะลอตัวบริเวณแนวต้านสำคัญ 38.57 แต่โครงสร้างหลักยังเป็นขาขึ้น หากราคาสามารถยืนเหนือเส้นแนวโน้ม (Up Trend) และผ่านแนวต้านที่ 38.57 ได้ จะมีโอกาสขึ้นทดสอบโซน 38.60–38.62 ตาม Bullish Scenario แต่หากไม่สามารถผ่าน 38.57 ได้ อาจเกิดแรงขายทำกำไรลงมาทดสอบโซน 38.51 และ 38.49 ซึ่งเป็นบริเวณ FVG อีกทั้ง SET Index มีแนวโน้มเปิดบวกเล็กน้อย ซึ่งอาจช่วยพยุงค่าเงินบาทและกดดัน EURTHB ในระยะสั้น
Support Level (แนวรับ): 38.54 – 38.51
Target (เป้าหมาย): 38.60 – 38.62
Stop Loss (คัท): 38.50
GBPTHB
Market Analysis: GBPTHB is expected to trade range-bound. UK CBI Industrial Trends Orders data released today is anticipated to have a limited impact on the Pound. Consequently, GBPTHB direction will rely heavily on U.S. Dollar dynamics and U.S. Initial Jobless Claims, which serve as key catalysts for market expectations regarding the Fed’s interest rate path.
บทวิเคราะห์ตลาด: GBPTHB มีแนวโน้มเคลื่อนไหวในกรอบ โดยวันนี้สหราชอาณาจักรมีการประกาศ CBI Industrial Trends Orders ซึ่งเป็นตัวชี้วัดภาคการผลิต แต่คาดว่าจะมีผลกระทบต่อ GBP ค่อนข้างจำกัด ทิศทางของ GBPTHB จึงยังขึ้นอยู่กับการเคลื่อนไหวของค่าเงินดอลลาร์สหรัฐฯ และตัวเลขจำนวนผู้ขอรับสวัสดิการว่างงานครั้งแรกของสหรัฐฯ (Initial Jobless Claims) ซึ่งใช้ประเมินแนวโน้มอัตราดอกเบี้ยของ Fed และอาจเป็นปัจจัยสำคัญที่กำหนดทิศทางการเคลื่อนไหวของ GBPTHB ในระยะสั้น
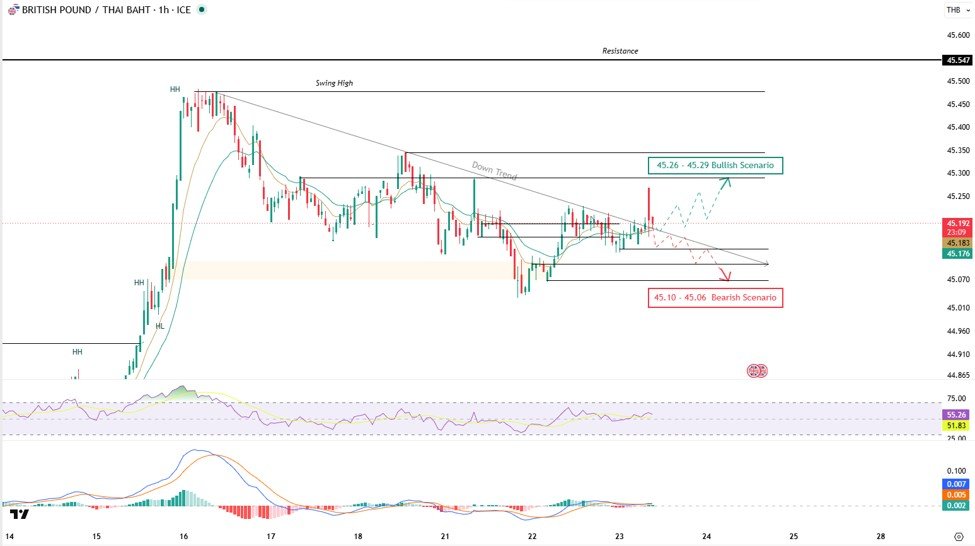
Technical Outlook: The price action is currently bound in a Sideway structure, lacking a new Higher High, though selling pressure shows signs of diminishing. RSI hovering around 55–56 above the 50 level indicates buyers are regaining control, supported by MACD remaining above the Signal line in positive territory. A breakout above resistance at 45.23 opens the way to test 45.26 – 45.29. On the downside, the macro structure remains bearish; failure to clear 45.23 could re-engage seller momentum toward support levels at 45.10 – 45.06, with additional pressure coming from potential Baht strength.
มุมมองทางเทคนิค: ภาพรวมกราฟ GBPTHB ยังคงเคลื่อนไหวในลักษณะ Sideway โดยโครงสร้างระยะสั้นยังไม่สามารถทำ Higher High ใหม่ได้ แต่แรงขายเริ่มอ่อนตัวลง ด้าน RSI ปรับตัวขึ้นมาอยู่บริเวณ 55-56 และกลับมายืนเหนือระดับ 50 สะท้อนว่าโมเมนตัมฝั่งซื้อเริ่มกลับมาได้เปรียบ ขณะที่ MACD เคลื่อนไหวเหนือเส้น Signal และ Histogram ยังอยู่ในแดนบวก หากสามารถผ่านแนวต้านที่ 45.23 ได้ มีโอกาสปรับตัวขึ้นทดสอบ 45.26 – 45.29 ตาม Bullish Scenario อย่างไรก็ตาม แม้โมเมนตัมระยะสั้นเริ่มส่งสัญญาณเป็นบวก แต่ภาพรวมราคายังคงอยู่ในแนวโน้มขาลง หากไม่สามารถผ่าน 45.23 ได้ อาจเกิดแรงขายกดดันให้ราคาย่อตัวลงทดสอบแนวรับบริเวณ 45.10 – 45.06 อีกทั้ง SET Index มีแนวโน้มเปิดบวกเล็กน้อย ซึ่งอาจช่วยพยุงค่าเงินบาทและกดดัน GBPTHB ในระยะสั้น
Support Level (แนวรับ): 45.13 – 45.10
Target (เป้าหมาย): 45.26 – 45.29
Stop Loss (คัท): 45.08
AUDTHB
Market Analysis: AUDTHB exhibits short-term bullish momentum as the VIX declines to 16.64, signalling a Risk-on sentiment that favors risk assets and the AUD. Investors are focusing on Australian employment data (Unemployment Rate and Employment Change) to gauge the RBA’s monetary policy path. Upbeat labor market figures would reinforce expectations of prolonged higher interest rates from the RBA, boosting AUDTHB, while weaker data could prompt short-term profit-taking.
บทวิเคราะห์ตลาด: AUDTHB มีแนวโน้มแข็งค่าในระยะสั้น โดยดัชนี VIX ปรับตัวลดลงสู่ระดับ 16.64 สะท้อนบรรยากาศการลงทุนแบบ Risk-on ซึ่งช่วยหนุนแรงซื้อสินทรัพย์เสี่ยงและค่าเงิน AUD ขณะที่วันนี้ตลาดจับตาการประกาศตัวเลขอัตราการว่างงาน (Unemployment Rate) และการเปลี่ยนแปลงการจ้างงาน (Employment Change) ของออสเตรเลีย ซึ่งเป็นปัจจัยสำคัญในการประเมินแนวโน้มนโยบายการเงินของธนาคารกลางออสเตรเลีย (RBA) หากตัวเลขออกมาดีกว่าคาด จะช่วยสนับสนุนการคาดการณ์ว่า RBA อาจคงอัตราดอกเบี้ยในระดับสูงเป็นระยะเวลานาน ส่งผลให้ AUDTHB ปรับตัวขึ้นต่อ แต่หากข้อมูลอ่อนแอกว่าคาด อาจเกิดแรงขายทำกำไรในระยะสั้น
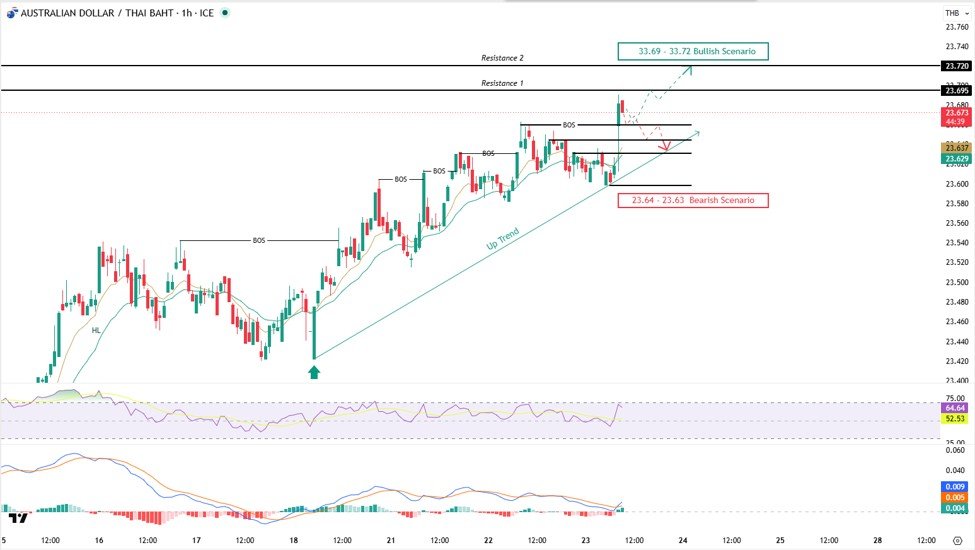
Technical Outlook: The pair remains in a clear Uptrend, validated by consecutive Break of Structure (BOS) signals and intact Higher High (HH) / Higher Low (HL) sequences bouncing off the trendline. Sustaining this bullish structure targets key resistance at 23.69 – 23.72. However, proximity to key resistance combined with an RSI nearing Overbought territory increases short-term retracement risk. Failure to hold above 23.69 could lead to a pullback toward 23.64 – 23.63, near the rising trendline.
มุมมองทางเทคนิค: ภาพรวมกราฟ AUDTHB ยังคงอยู่ในแนวโน้ม Uptrend อย่างชัดเจน โดยราคาสามารถสร้าง Break of Structure (BOS) ได้ต่อเนื่อง พร้อมรักษาโครงสร้าง Higher High (HH) และ Higher Low (HL) ไว้อย่างสมบูรณ์ ล่าสุดราคาดีดตัวขึ้นจากเส้นแนวโน้มขาขึ้น (Trendline) หากราคาสามารถคงโครงสร้างได้อย่างต่อเนื่อง มีโอกาสทดสอบแนวต้านบริเวณ 23.69 – 23.72 อย่างไรก็ดี เนื่องจากราคาเข้าใกล้แนวต้านสำคัญและ RSI เริ่มเข้าใกล้ Overbought หากไม่สามารถยืนเหนือ 23.69 ได้ มีโอกาสย่อตัวลงทดสอบแนวรับบริเวณ 23.64 – 23.63 อีกทั้ง SET Index มีแนวโน้มเปิดบวกเล็กน้อย ซึ่งอาจช่วยพยุงค่าเงินบาทและกดดัน AUDTHB ในระยะสั้น
Support Level (แนวรับ): 23.64 – 23.63 (Correction from original text 33.64 – 33.63)
Target (เป้าหมาย): 23.69 – 23.72 (Correction from original text 33.69 – 33.72)
Stop Loss (คัท): 23.62
CHFTHB
Market Analysis: A lower VIX (16.64) reflects Risk-on market conditions, dampening demand for safe-haven assets like the CHF and driving range-bound movement in CHFTHB. With no major Swiss economic releases today, price action depends heavily on broader market risk appetite, USD momentum, and ECB outcome signals. Dovish messaging from the ECB could further suppress safe-haven demand and weigh on CHFTHB, whereas global economic uncertainty could reignite safe-haven flows.
บทวิเคราะห์ตลาด: ดัชนี VIX ปรับตัวลงสู่ 16.64 สะท้อนบรรยากาศการลงทุนแบบ Risk-on ซึ่งลดความต้องการถือครองสินทรัพย์ปลอดภัยและกดดันค่าเงิน CHF ส่งผลให้ CHFTHB มีแนวโน้มเคลื่อนไหวทรงตัวในกรอบ โดยวันนี้สวิตเซอร์แลนด์ไม่มีการประกาศตัวเลขเศรษฐกิจสำคัญ ค่าเงิน CHF จึงเคลื่อนไหวตามความต้องการถือครองสินทรัพย์ปลอดภัย ทิศทางดอลลาร์ และผลการประชุม ECB หาก ECB ส่งสัญญาณ Dovish อาจทำให้ CHFTHB มีแนวโน้มทรงตัวถึงอ่อนค่าเล็กน้อย แต่หากตลาดกลับมากังวลต่อความเสี่ยงโลก CHF อาจได้รับแรงซื้อในฐานะสินทรัพย์ปลอดภัยอีกครั้ง
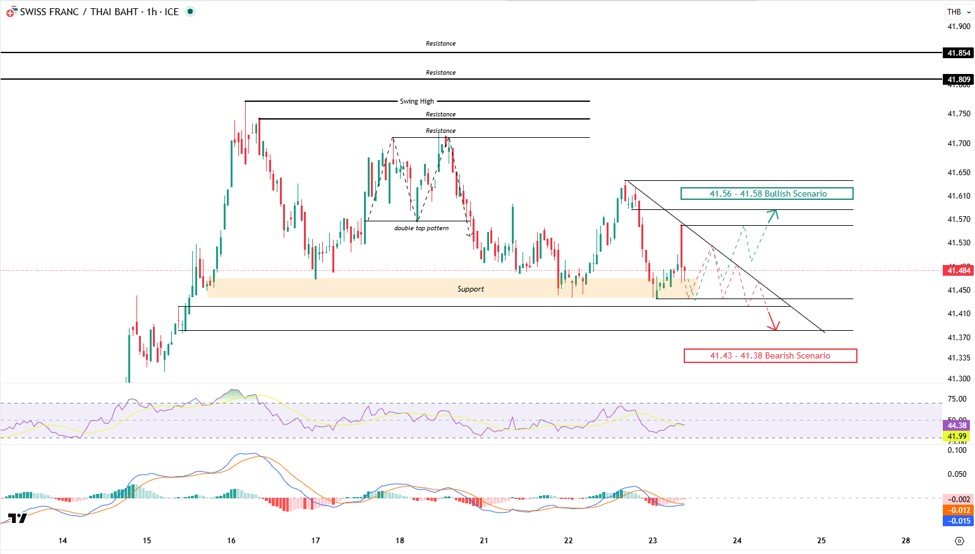
Technical Outlook: CHFTHB trades within a Sideways to Bearish structure following rejection from the Down Trend Line. While short-term pressure remains to the downside, a breakout and push above this trendline would invalidate the bearish bias and target resistance at 41.56 – 41.58. As long as price remains capped under the Down Trend Line, sellers hold the edge; a breakdown below 41.43 triggers bearish momentum toward 41.38, amplified by potential short-term Baht support from energy-led domestic stock gains.
มุมมองทางเทคนิค: ภาพรวมกราฟ CHFTHB ยังคงอยู่ในแนวโน้ม Sideways to Bearish หลังราคาถูกแรงขายกดลงจากบริเวณ Down Trend Line ทำให้โครงสร้างระยะสั้นยังมีโอกาสแกว่งตัวลงต่อ อย่างไรก็ตาม หากราคาสามารถกลับขึ้นมายืนเหนือเส้นแนวโน้มดังกล่าวได้ จะเป็นสัญญาณบวกและมีโอกาสฟื้นตัวขึ้นทดสอบ 41.56–41.58 ตาม Bullish Scenario ตราบใดที่ราคายังอยู่ต่ำกว่า Down Trend Line ภาพรวมยังให้น้ำหนักฝั่งขาย หากราคาหลุดแนวรับ 41.43 จะเพิ่มแรงขายลงสู่บริเวณ 41.38 อีกทั้ง SET Index มีแนวโน้มเปิดบวกเล็กน้อย ซึ่งอาจช่วยพยุงค่าเงินบาทและกดดัน CHFTHB ในระยะสั้น
Support Level (แนวรับ): 41.43 – 41.38
Target (เป้าหมาย): 41.56 – 41.58 (Correction from original typo 45.56)
Stop Loss (คัท): 41.42