
USDTHB
Fundamental Analysis The DXY index declined to 100.71, exerting short-term downward pressure on the pair. Although the 30-year US Treasury yield rose to 5.058%, buying pressure remained insufficient. The expansion of the Fed’s balance sheet ($6.736 trillion) and rising commercial bank reserves ($3.137 trillion) reflect increased liquidity, leaving USDTHB vulnerable to technical selling. Additionally, a positive opening in the Thai stock market could add further downward pressure.
ดัชนี DXY ปรับตัวลงสู่ 100.71 กดดันให้ USDTHB มีแนวโน้มอ่อนค่าระยะสั้น แม้อัตราผลตอบแทนพันธบัตรรัฐบาลสหรัฐฯ 30 ปี จะสูงขึ้นแตะ 5.058% แต่แรงซื้อยังไม่เพียงพอ ขณะที่งบดุลของ Fed และเงินสำรองธนาคารพาณิชย์ที่เพิ่มขึ้นสะท้อนสภาพคล่องในระบบที่สูงขึ้น ทำให้ราคาเผชิญแรงขายทางเทคนิค นอกจากนี้ หากตลาดหุ้นไทยเปิดบวกอาจเป็นปัจจัยกดดันเพิ่มเติม
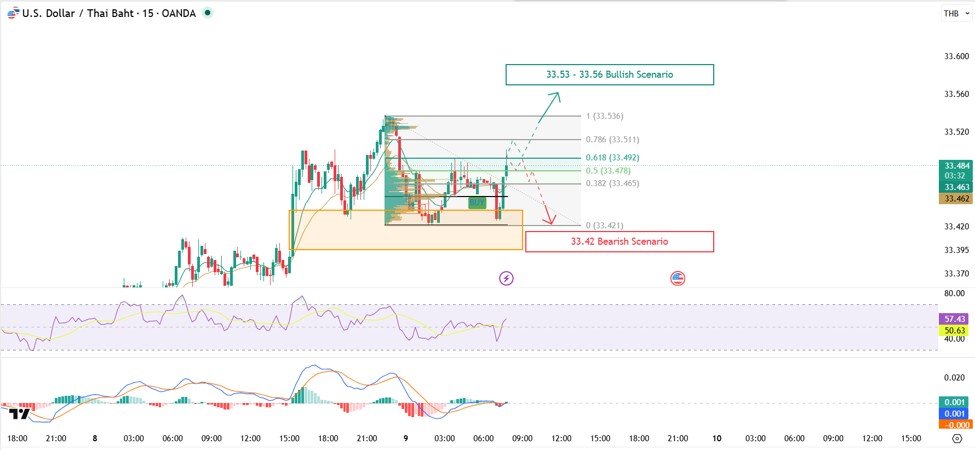
Price Structure & Technicals : Bearish Bias. The price broke below key support and the EMA line, nearing the Order Block (OB) zone at 33.29–33.30. The RSI is oversold at around 27, suggesting a potential short-term Technical Rebound, but the MACD remains firmly in negative territory. If a rebound fails to clear 33.29–33.30, further sell-offs are expected.
Bearish Bias (แนวโน้มขาลง) โครงสร้างราคาหลุดแนวรับสำคัญและเส้น EMA ลงมาใกล้โซน Order Block (OB) ที่ 33.29–33.30 ด้าน RSI อยู่บริเวณ 27 (Oversold) มีโอกาสเกิด Technical Rebound ระยะสั้น แต่ MACD ยังคงโมเมนตัมฝั่งขายที่แข็งแกร่ง หากรีบาวด์ไม่ผ่าน 33.29–33.30 มีโอกาสถูกเทขายอีกครั้ง
Support / แนวรับ: 33.29 – 33.24
Resistance / แนวต้าน: 33.41
Target / เป้าหมาย: 33.41 – 33.46 (Fair Value Gap zone)
Cut Loss / จุดตัดขาดทุน: 33.22
EURTHB
Fundamental Analysis EURTHB leans toward consolidation with a slight bullish bias, supported in the short term by broader USDTHB strength following the FOMC minutes. Today, the market is closely monitoring the ECB Meeting Minutes; any hawkish signals from the European Central Bank could provide further upside for the EUR. Conversely, a positive opening in the Thai stock market could exert downward pressure on the pair.
แนวโน้มเคลื่อนไหวทรงตัวถึงแข็งค่า ได้รับแรงพยุงระยะสั้นจากทิศทางของ USDTHB ที่มีแนวโน้มแข็งค่ารับรายงานการประชุม FOMC วันนี้ตลาดจับตารายงานการประชุมนโยบายการเงินของธนาคารกลางยุโรป (ECB Meeting Minutes) อย่างใกล้ชิด หากส่งสัญญาณ Hawkish จะช่วยหนุนค่าเงิน EUR เพิ่มเติม อย่างไรก็ตาม หากตลาดหุ้นไทยเปิดบวกในช่วงเช้าอาจเป็นปัจจัยกดดันราคาเพิ่มเติม
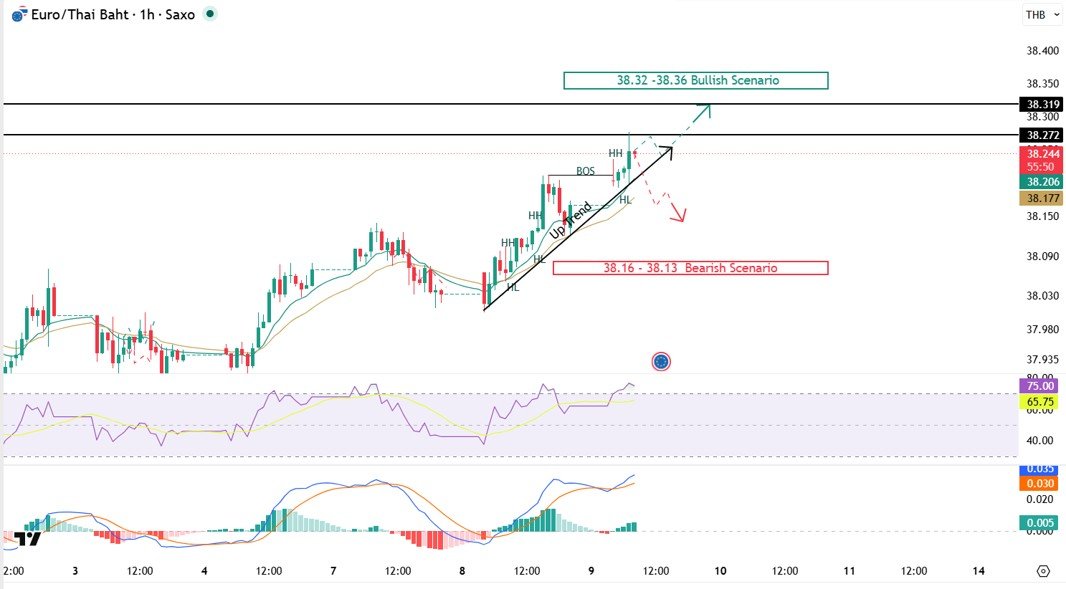
Price Structure & Technicals. The chart maintains a clear uptrend, continuously forming Higher Highs (HH) and Higher Lows (HL), with a Break of Structure (BOS) confirming the upward momentum. However, the RSI is currently in the Overbought territory, posing a risk of short-term profit-taking. If the price fails to break the 38.27–38.32 resistance zone, it may retrace to test lower supports before advancing further.
Bullish Bias (แนวโน้มขาขึ้น) ภาพรวมกราฟยังคงเดินหน้าทำ Higher High (HH) และ Higher Low (HL) อย่างต่อเนื่อง พร้อมเกิด Break of Structure (BOS) ยืนยันโมเมนตัมขาขึ้น อย่างไรก็ตาม RSI ที่เข้าสู่เขต Overbought ทำให้มีความเสี่ยงต่อแรงขายทำกำไรระยะสั้น หากราคาไม่สามารถทะลุผ่านแนวต้านบริเวณ 38.27–38.32 ได้ อาจเห็นการย่อตัวลงมาพักฐาน
Support / แนวรับ: 38.23 – 38.20
Resistance / แนวต้าน: 38.27 – 38.32
Target / เป้าหมาย: 38.32 – 38.36
Cut Loss / จุดตัดขาดทุน: 38.19
GBPTHB
Fundamental Analysis / ปัจจัยพื้นฐานพอสังเขป: EN: GBPTHB leans toward consolidation with an upside bias, supported by the FOMC minutes indicating the Fed is in no rush to cut rates. Markets are currently monitoring the UK RICS House Price Index; better-than-expected data could further boost the GBP.
แนวโน้มทรงตัวถึงแข็งค่า ได้รับแรงหนุนจาก USDTHB ที่แข็งค่าหลัง Fed ไม่เร่งลดดอกเบี้ย ตลาดจับตาดัชนีราคาบ้าน RICS ของสหราชอาณาจักร หากตัวเลขออกมาดีกว่าคาดจะเป็นปัจจัยหนุน GBP เพิ่มเติม
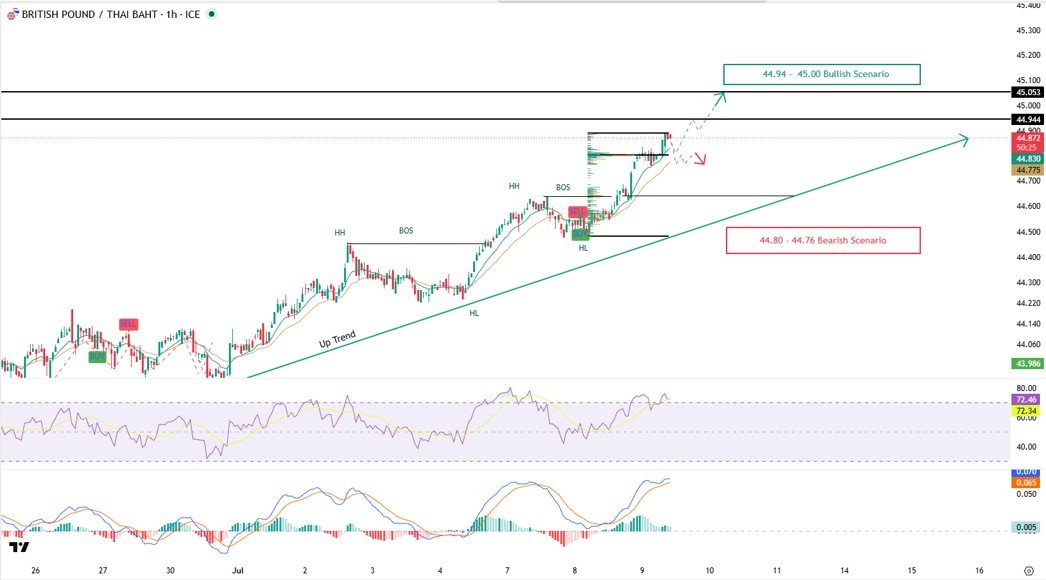
Price Structure & Technicals / โครงสร้างราคาและเทคนิค. A clear uptrend with consecutive HH, HL, and multiple BOS confirmations. Buying momentum remains dominant. However, the RSI is currently in the Overbought territory, presenting a risk of short-term pullback toward the 44.80–44.76 support zone if the price rejects the 44.94 resistance.
Bullish Bias (แนวโน้มขาขึ้น) โครงสร้างชัดเจนจากการทำ HH, HL และ BOS หลายครั้ง โมเมนตัมฝั่งซื้อได้เปรียบ แต่เนื่องจาก RSI เข้าสู่เขต Overbought จึงต้องระวังการขายทำกำไร หากราคาไม่สามารถทะลุ 44.94 ได้ อาจย่อตัวลงมาพักฐาน
Support / แนวรับ: 44.80 – 44.76
Resistance / แนวต้าน: 44.94
Target / เป้าหมาย: 44.94 – 45.00
Cut Loss / จุดตัดขาดทุน: 44.74
AUDTHB
Fundamental Analysis The pair is expected to remain steady or appreciate. While China’s lower-than-expected June CPI reflects weak domestic demand and pressures the AUD short-term, this is offset by broader USDTHB strength following the cautious FOMC minutes.
แนวโน้มทรงตัวถึงแข็งค่า แม้ดัชนี CPI เดือนมิถุนายนของจีน (คู่ค้ารายใหญ่) จะออกมาต่ำกว่าคาดและกดดัน AUD ระยะสั้น แต่ถูกชดเชยด้วยทิศทางของ USDTHB ที่ยังแข็งค่ารับรายงานการประชุม FOMC ที่สะท้อนความระมัดระวังของ Fed
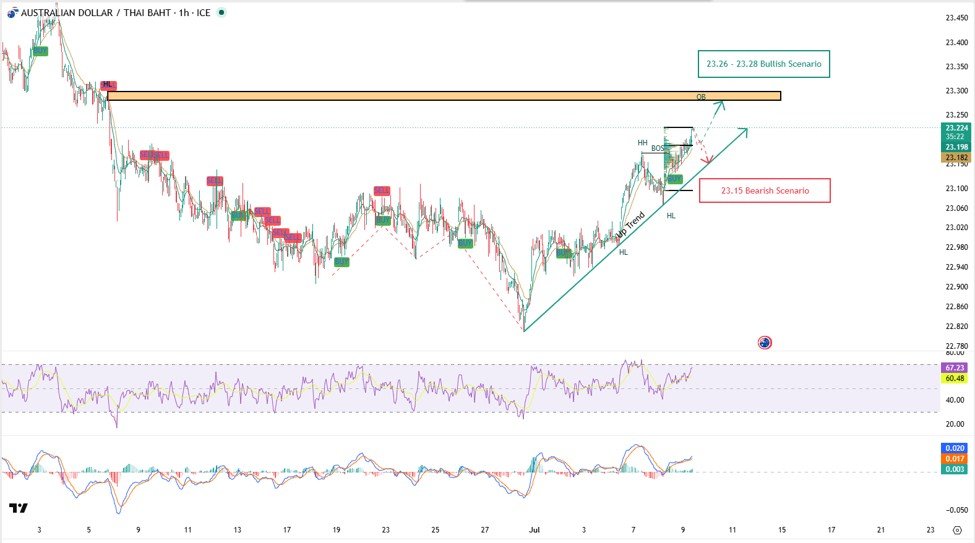
Price Structure & Technicals / โครงสร้างราคาและเทคนิค: Bullish Bias. The chart shows continuous Higher Highs (HH) and Higher Lows (HL) with a Break of Structure (BOS) confirming an uptrend above the EMA. The RSI is at 67 (bullish control), and the MACD histogram is positive. However, as the RSI nears the Overbought zone, short-term profit-taking may occur if the price fails to break 23.23. Bullish Bias (แนวโน้มขาขึ้น) ราคายกตัวทำ Higher High (HH) และ Higher Low (HL) ต่อเนื่อง พร้อมเกิด Break of Structure (BOS) ยืนเหนือเส้น EMA RSI อยู่ที่ระดับ 67 และ MACD เป็นบวกสะท้อนแรงซื้อที่แข็งแกร่ง อย่างไรก็ตาม RSI ที่ใกล้เขต Overbought อาจทำให้เกิดแรงขายทำกำไรระยะสั้น หากไม่ผ่าน 23.23
Risks: Despite the primary bullish structure, slowing RSI and MACD indicators suggest that buying power is weakening in the short term. If the price fails to stay above the EMA line, it could pull back to test support levels at 23.15 and 23.13. Moreover, a positive opening in the Thai stock market during the morning session could apply additional pressure on AUDTHB.
แม้โครงสร้างหลักยังเป็นขาขึ้น แต่การที่ RSI และ MACD ชะลอตัว สะท้อนว่าแรงซื้อเริ่มอ่อนลงในระยะสั้น หากราคาไม่สามารถยืนเหนือเส้น EMA ได้ มีโอกาสย่อตัวลงทดสอบแนวรับบริเวณ 23.15 และ 23.13 อีกครั้ง อีกทั้งหากตลาดหุ้นไทยช่วงเช้าเปิดบวกมีโอกาสกดดัน AUDTHB เพิ่มเติมได้
- Support / แนวรับ: 23.18 – 23.15
- Resistance / แนวต้าน: 23.23
- Target / เป้าหมาย: 23.26 – 23.28 (Order Block zone)
- Cut Loss / จุดตัดขาดทุน: 23.13
CHFTHB
Fundamental Analysis Expected to range-trade with a slight bullish bias. With no major Swiss economic data, focus shifts to US Initial Jobless Claims and Existing Home Sales. Weak US data could trigger safe-haven flows into the CHF, while cautious Fed policy continues to act as underlying support.
แนวโน้มทรงตัวถึงแข็งค่าเล็กน้อย วันนี้ไม่มีตัวเลขเศรษฐกิจสำคัญจากสวิส ตลาดจึงรอดูตัวเลขผู้ขอรับสวัสดิการว่างงานและยอดขายบ้านมือสองของสหรัฐฯ หากข้อมูลอ่อนแอจะหนุนแรงซื้อ CHF ในฐานะสินทรัพย์ปลอดภัย
Price Structure & Technicals
Bullish Bias. The price has broken above its previous accumulation zone and maintains its position above the EMA. The RSI is at 66 with no bearish divergence, and the MACD indicates strong buying momentum. A rapid rise poses a minor profit-taking risk; failure to hold 41.50 could lead to a retest of lower supports.
Bullish Bias (แนวโน้มขาขึ้น) ราคา Break กรอบสะสมเดิมและยืนเหนือ EMA ได้ต่อเนื่อง RSI อยู่บริเวณ 66 ยังไม่มีสัญญาณ Bearish Divergence และ MACD ตัดขึ้นแดนบวกชัดเจน อย่างไรก็ดี การปรับตัวขึ้นเร็วอาจตามมาด้วยแรงขายทำกำไร หากไม่ผ่าน 41.50 อาจเห็นการย่อตัว
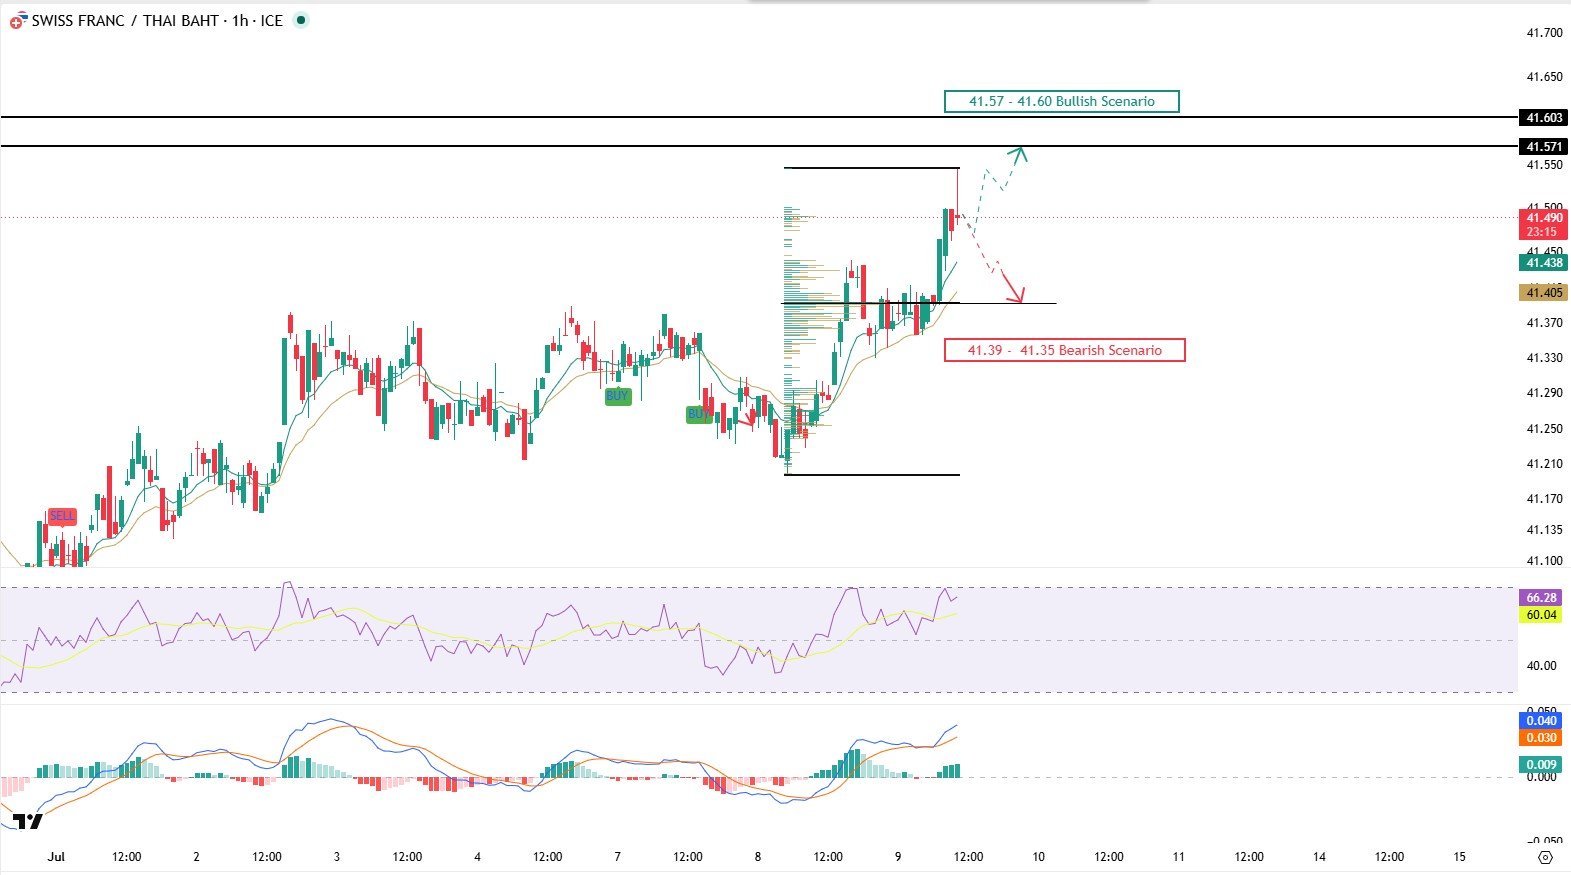
Support / แนวรับ: 41.39 – 41.35
Resistance / แนวต้าน: 41.50
Target / เป้าหมาย: 41.57 – 41.60
Cut Loss / จุดตัดขาดทุน: 41.34
https://th.tradingview.com/u/Soponwit_AISA_MSc/