
USDTHB
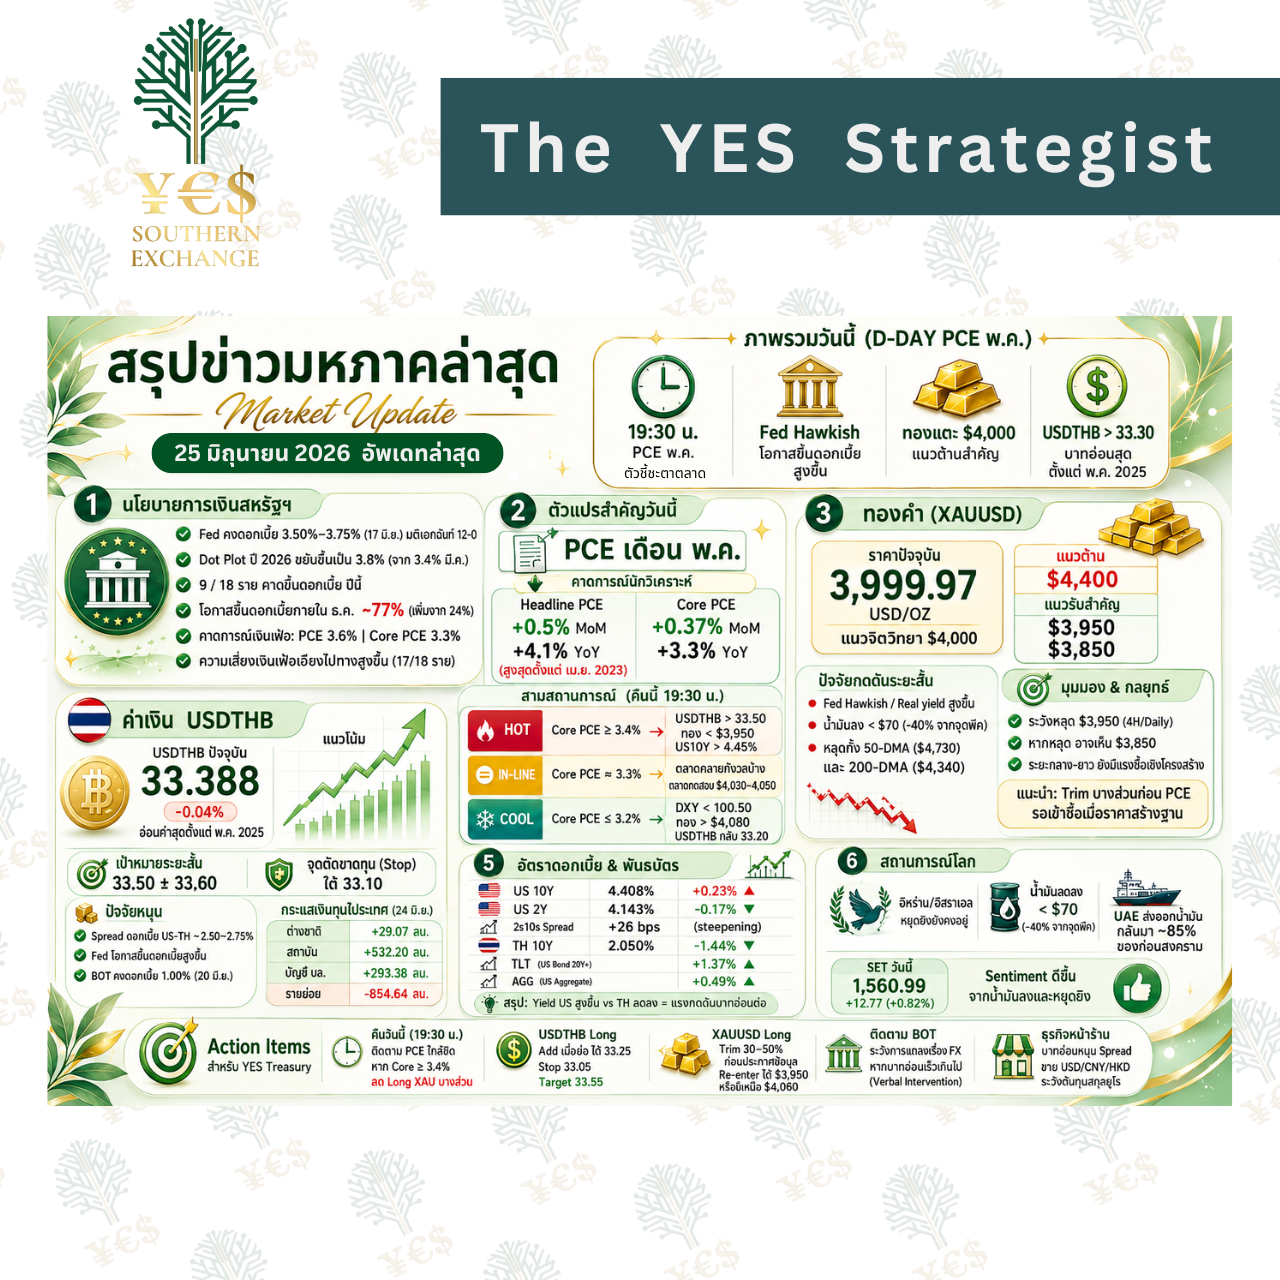
Market Analysis: The DXY index moved sideways after a sharp rally, leading to short-term consolidation for USDTHB. Meanwhile, gold prices dropping below $4,000/oz reduced support for the Baht, favoring a stronger USDTHB. Key US economic data tonight includes May Core PCE (previously 3.3%), MoM PCE Price Index (expected at 0.3% vs 0.2% prior),
final Q1 GDP (expected at 1.6%), and Initial Jobless Claims (expected at 226K). Higher-than-expected inflation or a tight labor market could signal higher-for-longer Fed rates, boosting the USD and driving USDTHB higher in the short term.
ดัชนี DXY เคลื่อนไหวในกรอบทรงตัวหลังปรับตัวขึ้นแรงก่อนหน้า ส่งผลให้ USDTHB แกว่งตัวสะสมกำลังในกรอบแคบระยะสั้น ขณะที่ราคาทองคำปรับตัวหลุดระดับ 4,000 ดอลลาร์ต่อออนซ์ ช่วยลดแรงหนุนต่อค่าเงินบาทและสนับสนุนการแข็งค่าของ USDTHB คืนนี้จับตาตัวเลขเศรษฐกิจสำคัญของสหรัฐฯ นำโดยดัชนี Core PCE เดือนพ.ค. (ครั้งก่อน 3.3%) PCE Price Index MoM (คาดเพิ่มขึ้น 0.3% จาก 0.2%) GDP ไตรมาส 1 Final (คาดขยายตัว 1.6%) และยอดผู้ขอรับสวัสดิการว่างงาน (คาดอยู่ที่ 226K) หากเงินเฟ้อสูงกว่าคาดและตลาดแรงงานยังแข็งแกร่ง อาจเพิ่มโอกาสที่ Fed จะคงดอกเบี้ยสูงนานขึ้น ซึ่งเป็นปัจจัยหนุน USD และกดดันให้ USDTHB มีโอกาสปรับตัวขึ้นต่อได้ในระยะสั้น
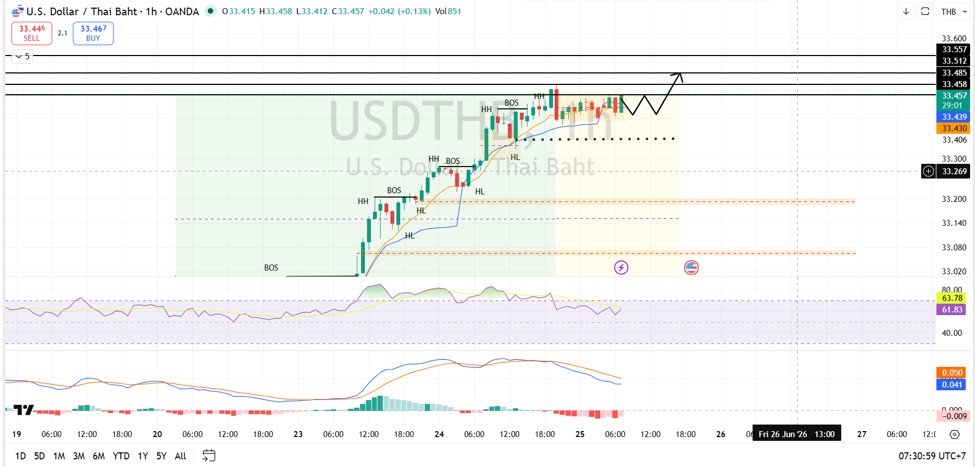
Technical Outlook: The overall chart remains in an uptrend, forming a continuous Higher High (HH) and Higher Low (HL) structure. The price is currently in a consolidation phase. The RSI hovers around 61-64, reflecting positive momentum without entering the overbought zone. Although the MACD shows slight exhaustion, it has yet to signal a clear reversal, maintaining a bullish bias. If the price holds above the key level of 33.45 – 33.48, it has the potential to test the resistance zone at 33.51 – 33.55. A negative opening in the Thai stock market this morning could provide additional upward momentum for USDTHB.
ภาพรวมกราฟยังอยู่ในแนวโน้มขาขึ้นหลังสามารถสร้างโครงสร้าง Higher High (HH) และ Higher Low (HL) ได้ต่อเนื่อง ล่าสุดราคากำลังพักตัวสะสมกำลัง โดย RSI อยู่บริเวณ 61-64 สะท้อนโมเมนตัมบวกที่ยังไม่เข้าภาวะ Overbought ขณะที่ MACD แม้อ่อนแรงลงเล็กน้อยแต่ยังไม่ส่งสัญญาณกลับตัวลงชัดเจน ทำให้ภาพรวมยังให้น้ำหนักฝั่งขาขึ้น หากราคาสามารถยืนเหนือระดับสำคัญบริเวณ 33.45 – 33.48 ได้ มีโอกาสขึ้นไปทดสอบแนวต้านที่ 33.51 – 33.55 อีกทั้งหากตลาดหุ้นไทยช่วงเช้าเปิดลบอาจช่วยหนุน USDTHB เพิ่มเติม
- Support Level (แนวรับ): 33.34
- Target (เป้าหมาย): 33.51 – 33.55
- Stop Loss (คัท): 33.33
EURTHB
Market Analysis: EURTHB is expected to move within a consolidation range. Despite a limited range in EURUSD, the sideways movement of USDTHB leaves EURTHB lacking clear directional catalysts in the short term. Key indicators to watch today include Germany’s GfK Consumer Climate index (expected to improve to -27.6 from -29.8), the ECB’s monthly report, and a speech by Philip Lane. Positive signs regarding the Eurozone economy could provide support for the EUR.
EURTHB มีแนวโน้มเคลื่อนไหวในกรอบทรงตัว แม้ EURUSD จะยังเคลื่อนไหวในกรอบจำกัด แต่เนื่องจาก USDTHB อยู่ในช่วงสะสมกำลังในกรอบแคบ ส่งผลให้ EURTHB ยังขาดปัจจัยหนุนให้เกิดทิศทางที่ชัดเจนในระยะสั้น วันนี้ติดตามดัชนีความเชื่อมั่นผู้บริโภค GfK ของเยอรมนี (คาดปรับตัวดีขึ้นสู่ -27.6 จาก -29.8) รวมถึงรายงานประจำเดือนของ ECB และถ้อยแถลงของ Philip Lane หากข้อมูลสะท้อนแนวโน้มเศรษฐกิจที่ดีขึ้น อาจช่วยหนุนค่าเงิน EUR ได้
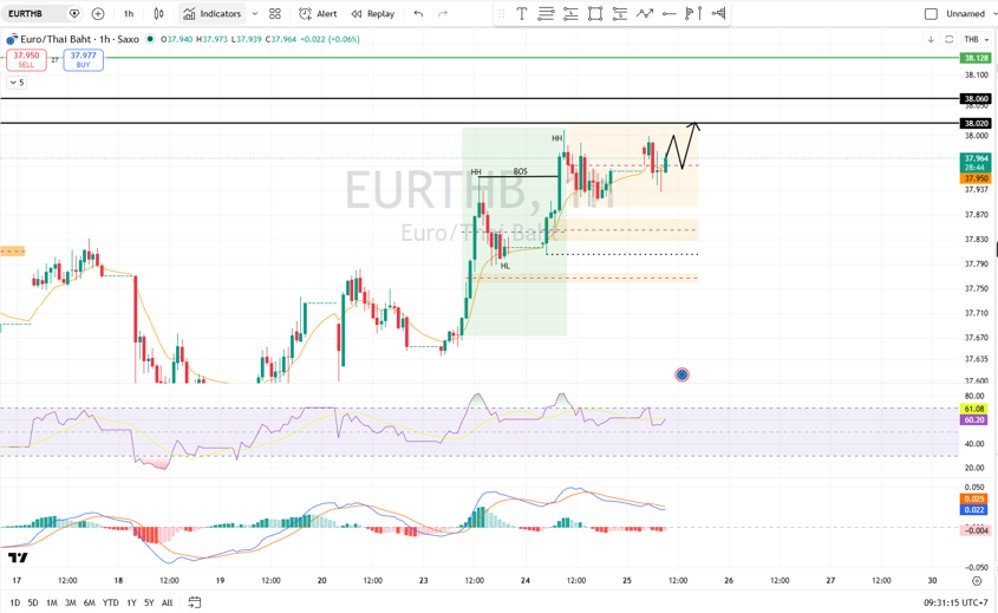
Technical Outlook: The overall trend for EURTHB remains bullish after breaking out above its previous structure and forming consecutive Higher Highs and Higher Lows. The pair is currently trading around 37.96 – 37.97 within a consolidation zone below a key resistance. The RSI sits at 61.10, indicating neutral-to-bullish conditions. The MACD stays above the signal line; although the histogram has dipped slightly into negative territory, showing a short-term slowdown in buying pressure, it does not confirm a trend reversal. Holding above short-term support at 37.95 opens the door for a retest of the major resistance at 38.02 – 38.06. A lower open in the Thai stock market would further support this pair.
ภาพรวมกราฟยังคงเป็นแนวโน้มขาขึ้นหลังราคาสามารถ Breakout เหนือโครงสร้างเดิมและสร้าง Higher High (HH) และ Higher Low (HL) ต่อเนื่อง ล่าสุดเคลื่อนไหวบริเวณ 37.96-37.97 ในกรอบสะสมกำลังใต้แนวต้านสำคัญ ขณะที่ RSI อยู่ที่ระดับ 61.10 สะท้อนภาวะ Neutral ค่อนไปทาง Bullish และ MACD ยังอยู่เหนือเส้น Signal แม้ Histogram ติดลบเล็กน้อยสะท้อนการชะลอตัวของแรงซื้อระยะสั้นแต่ยังไม่ยืนยันการกลับตัวลง หากราคาสามารถยืนเหนือแนวรับระยะสั้นบริเวณ 37.95 ได้ มีโอกาสปรับตัวขึ้นไปทดสอบแนวต้านสำคัญบริเวณ 38.02-38.06 อีกครั้ง อีกทั้งหากตลาดหุ้นไทยช่วงเช้าเปิดลบอาจสนับสนุน EURTHB เพิ่มเติม
- Support Level (แนวรับ): 37.89
- Target (เป้าหมาย): 38.02 – 38.06
- Stop Loss (คัท): 37.87
GBPTHB
Market Analysis: GBPTHB is projected to trade sideways, tracking the movement of USDTHB as the DXY index remains range-bound. Today’s focus is on the UK CBI Distributive Trades survey, which is anticipated to improve to -41 from -46. A stronger-than-expected reading could indicate a recovery in household spending and support the GBP in the short term. However, the pair will likely continue to take its primary cues from major US economic data releases, which will dictate Fed policy and USD direction.
GBPTHB มีแนวโน้มเคลื่อนไหวทรงตัวตามทิศทาง USDTHB หลังดัชนี DXY ยังแกว่งตัวในกรอบจำกัด โดยวันนี้ติดตามผลสำรวจภาคค้าปลีก CBI ของสหราชอาณาจักร (คาดว่าจะปรับตัวดีขึ้นสู่ระดับ -41 จาก -46) หากตัวเลขออกมาดีกว่าคาด อาจสะท้อนการฟื้นตัวของการใช้จ่ายภาคครัวเรือนและช่วยหนุนค่าเงิน GBP ในระยะสั้น อย่างไรก็ตาม ทิศทางหลักยังคงต้องติดตามข้อมูลเศรษฐกิจสำคัญของสหรัฐฯ ซึ่งจะส่งผลต่อมุมมองดอกเบี้ย Fed และทิศทางค่าเงิน USD ทำให้ GBPTHB ยังคงเคลื่อนไหวตามทิศทางของ USDTHB เป็นหลัก
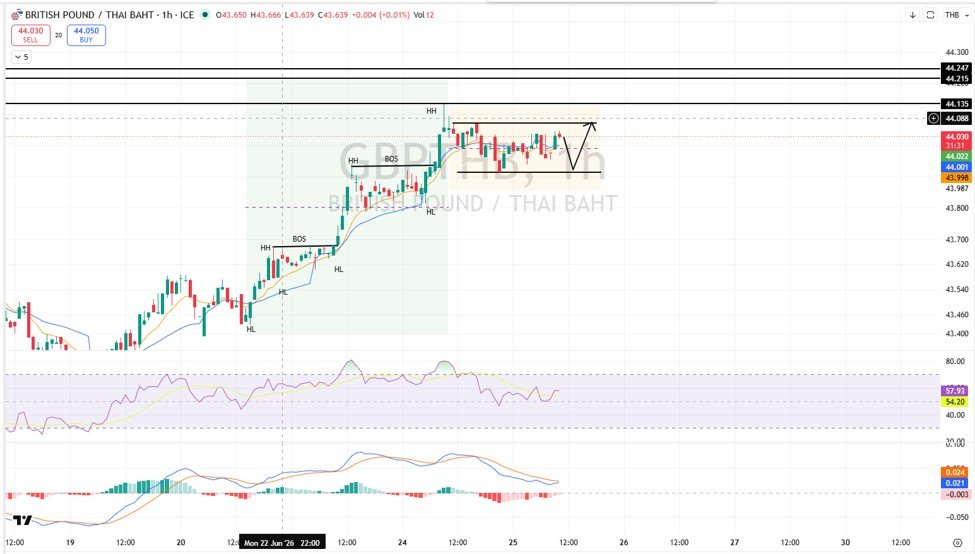
Technical Outlook: The broader picture for GBPTHB points to a continuing uptrend, characterized by breakouts over old levels and a sequence of Higher Highs and Higher Lows. Currently, the price has entered a sideways consolidation pattern above key support at 43.97. The RSI is at 57.93 (neutral-to-bullish), and the MACD remains above its signal line. Although a slightly negative histogram points to a short-term deceleration in bullish momentum, no clear bearish reversal signal has formed. If the price maintains its footing above 43.97, it could push toward the 44.07 resistance, with a successful breakout exposing the 44.13 – 44.21 target area.
ภาพรวมกราฟยังคงเคลื่อนไหวในแนวโน้มขาขึ้น หลังราคาสามารถ Breakout เหนือโครงสร้างเดิมและสร้าง Higher High (HH) และ Higher Low (HL) ต่อเนื่อง ล่าสุดราคาเข้าสู่ช่วง Sideway สะสมกำลังเหนือแนวรับสำคัญบริเวณ 43.97 ขณะที่ RSI อยู่ที่ระดับ 57.93 สะท้อนภาวะ Neutral ค่อนไปทาง Bullish และ MACD ยังอยู่เหนือเส้น Signal แม้ Histogram เป็นลบเล็กน้อยสะท้อนโมเมนตัมขาขึ้นชะลอตัวในระยะสั้น แต่ยังไม่ส่งสัญญาณกลับตัวชัดเจน หากราคายืนเหนือแนวรับ 43.97 ได้ มีโอกาสปรับตัวขึ้นไปทดสอบแนวต้านสำคัญบริเวณ 44.07 และหาก Breakout ผ่านได้ มีโอกาสขยายตัวขึ้นต่อยอดไปที่กรอบ 44.13-44.21
- Support Level (แนวรับ): 43.97 – 43.91
- Target (เป้าหมาย): 44.13 – 44.21
- Stop Loss (คัท): 43.89
AUDTHB
Market Analysis: Investors trimmed risk exposure and took profits across multiple asset classes overnight in anticipation of critical US economic data, which capped the AUD’s short-term upside. Today, AUDTHB is poised to trade with a sideways to sideways-up bias following better-than-expected Australian labor data. Employment surged by 40.3K, and the unemployment rate fell to 4.4%. This highlights economic resilience and could temper RBA rate-cut expectations, acting as a positive driver for the AUD in the near term.
เมื่อคืนนักลงทุนทยอยลดความเสี่ยงและขายทำกำไรในสินทรัพย์หลายประเภทเพื่อรอติดตามข้อมูลเศรษฐกิจสำคัญของสหรัฐฯ ทำให้การแข็งค่าของ AUD ยังถูกจำกัดในระยะสั้น สำหรับวันนี้ AUDTHB มีแนวโน้มแกว่งตัวในกรอบ Sideway ถึง Sideway Up หลังตัวเลขตลาดแรงงานออสเตรเลียออกมาดีกว่าคาด โดยการจ้างงานเพิ่มขึ้น 40.3K ตำแหน่ง และอัตราการว่างงานลดลงสู่ 4.4% สะท้อนความแข็งแกร่งของเศรษฐกิจและอาจช่วยลดความคาดหวังต่อการปรับลดอัตราดอกเบี้ยของ RBA ซึ่งเป็นปัจจัยบวกต่อค่าเงิน AUD ในระยะสั้น
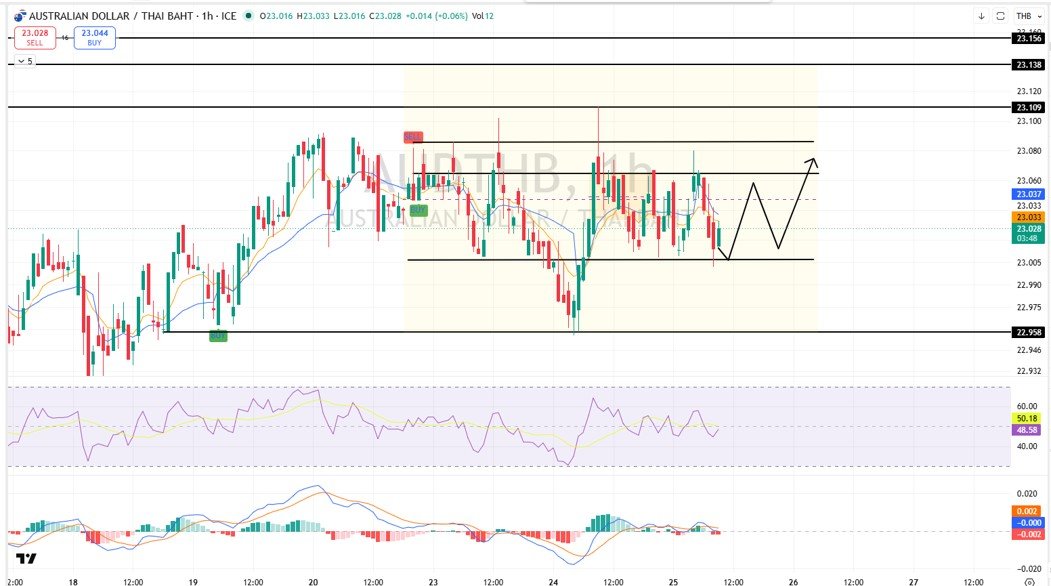
Technical Outlook: AUDTHB continues to trade within a sideways range of 23.00 – 23.08, as the price has yet to break out of its current consolidation block decisively. The pair is currently trading near the midpoint of the range at 23.03. The RSI rests at 49.82, indicating a perfectly neutral state. The MACD is slightly below the signal line with a negative histogram, showing a mild but unconvincing edge for sellers. As long as the price sustains above the critical 23.00 support level, a rebound toward the 23.06 – 23.08 resistance area remains likely.
ภาพรวมกราฟยังคงเคลื่อนไหวในลักษณะ Sideway ภายในกรอบราคา 23.00-23.08 หลังราคายังไม่สามารถ Breakout ออกจากกรอบการสะสมกำลังได้อย่างชัดเจน ล่าสุดราคาเคลื่อนตัวอยู่บริเวณ 23.03 ใกล้กึ่งกลางกรอบการเคลื่อนไหว ขณะที่ RSI อยู่ที่ระดับ 49.82 สะท้อนภาวะ Neutral และ MACD อยู่ต่ำกว่าเส้น Signal เล็กน้อยพร้อม Histogram เป็นลบ แสดงถึงโมเมนตัมฝั่ง Sell ที่ได้เปรียบเพียงเล็กน้อย แต่ยังไม่แข็งแรงพอจะเปลี่ยนแนวโน้มเป็นขาลง หากราคาสามารถยืนเหนือแนวรับสำคัญบริเวณ 23.00 ได้ มีโอกาสรีบาวด์ขึ้นไปทดสอบแนวต้านบริเวณ 23.06-23.08 อีกครั้ง
- Support Level (แนวรับ): 23.00
- Target (เป้าหมาย): 23.06 – 23.08
- Stop Loss (คัท): 22.99
CHFTHB
Market Analysis: CHFTHB is expected to trade with a stable to slightly firm bias. The CHF continues to draw strength from safe-haven flows as markets await crucial US economic indicators. With no major data releases scheduled from Switzerland today, market participants are heavily focused on global risk sentiment and the upcoming US PCE report. Any spike in market volatility or uncertainty could provide additional short-term tailwinds for the Swiss Franc.
CHFTHB มีแนวโน้มเคลื่อนไหวทรงตัวถึงแข็งค่าเล็กน้อย โดยค่าเงิน CHF ยังคงได้รับแรงหนุนจากสถานะสินทรัพย์ปลอดภัย ท่ามกลางการรอติดตามข้อมูลเศรษฐกิจสำคัญของสหรัฐฯ ในสัปดาห์นี้ วันนี้ไม่มีตัวเลขเศรษฐกิจสำคัญจากสวิตเซอร์แลนด์ นักลงทุนจึงให้น้ำหนักกับทิศทางเศรษฐกิจโลกและการประกาศดัชนี PCE ของสหรัฐฯ เป็นหลัก ทั้งนี้ หากความผันผวนหรือความไม่แน่นอนในตลาดการเงินเพิ่มสูงขึ้น CHF ในฐานะสินทรัพย์ปลอดภัยอาจได้รับแรงหนุนเพิ่มเติมในระยะสั้น
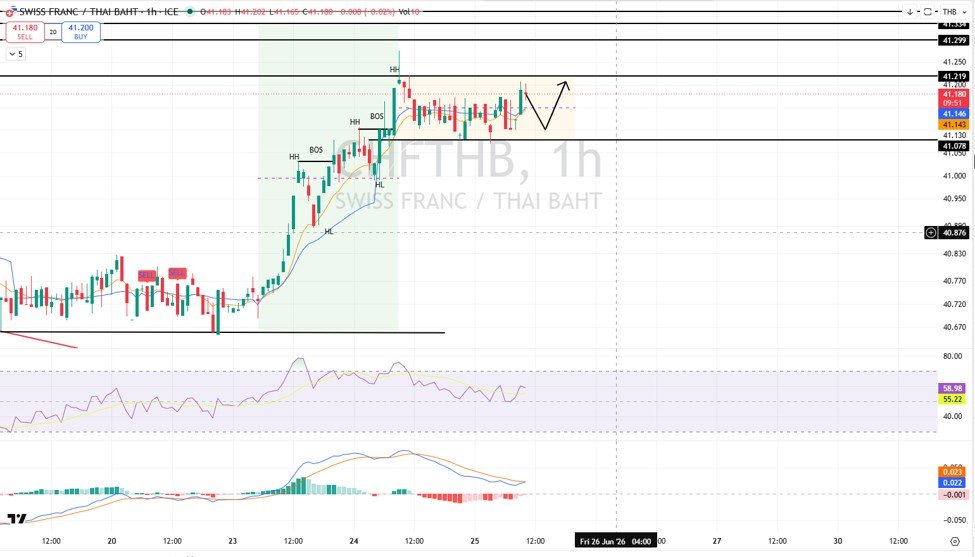
Technical Outlook: The technical framework for CHFTHB leans sideways-to-bullish after a sharp upward move led into a consolidation phase above key support. The price is currently hovering around 41.18 – 41.20, just below major resistance at 41.22. The RSI stands at 58.98, pointing to a neutral-to-bullish bias. The MACD is crossing above the signal line, accompanied by a shrinking negative histogram, which suggests that selling pressure is waning and a near-term buying rebound is brewing. A clean breakout above 41.22 would open the path toward the 41.23 – 41.27 resistance zone.
ภาพรวมกราฟยังคงเคลื่อนไหวในลักษณะ Sideway to Bullish หลังราคาปรับตัวขึ้นแรงและเข้าสู่ช่วงสะสมกำลังเหนือแนวรับสำคัญ ล่าสุดราคาเคลื่อนตัวบริเวณ 41.18-41.20 ใต้แนวต้านสำคัญที่ 41.22 ขณะที่ RSI อยู่ที่ระดับ 58.98 สะท้อนภาวะ Neutral ค่อนไปทาง Bullish และ MACD เริ่มตัดขึ้นใกล้เส้น Signal พร้อม Histogram ที่หดตัวลงจากแดนลบ สะท้อนว่าแรงขายเริ่มอ่อนกำลังและมีโอกาสเกิดแรงซื้อกลับในระยะสั้น หากราคาสามารถ Breakout เหนือบริเวณ 41.22 ได้ มีโอกาสปรับตัวขึ้นต่อไปทดสอบแนวต้านบริเวณ 41.23-41.27
- Support Level (แนวรับ): 41.10 – 41.08
- Target (เป้าหมาย): 41.23 – 41.27
- Stop Loss (คัท): 41.07
https://th.tradingview.com/u/Soponwit_AISA_MSc/