USDTHB
Market Analysis: The Baht experienced a slight recovery following a “panic sell” during the recent holiday period. Despite the NESDC reporting GDP figures that exceeded expectations, the overall growth rate remains low, exerting downward pressure on the Baht during this morning’s session.
เช้านี้เงินบาทปรับตัวอ่อนค่าลงเล็กน้อย แม้ว่ารายงาน GDP จากสภาพัฒน์จะออกมาดีกว่าที่คาดการณ์ไว้ แต่เนื่องจากยังคงอยู่ในโซนการเติบโตต่ำ ประกอบกับการรีบาวด์หลังจากแรงเทขาย (Panic Sell) ในช่วงวันหยุดที่ผ่านมา จึงยังเป็นปัจจัยกดดันค่าเงินบาทในระยะสั้น
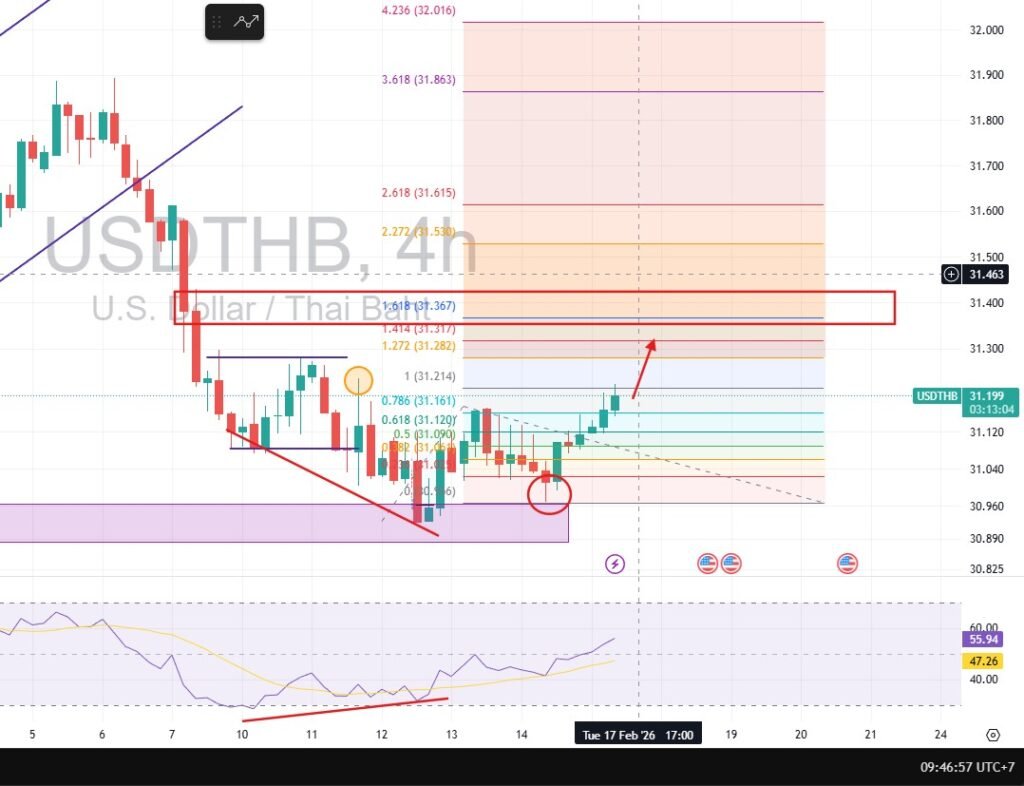
Technical Outlook: On the 4-hour timeframe (4H), a Bullish Divergence has emerged, followed by a successful breakout. The price action is forming a “Higher Low” structure, signaling a potential shift to an uptrend. Based on Fibonacci Projection, the immediate resistance target is identified at 31.35.
ในทางเทคนิค สัญญาณการกลับตัวใน TF 4H เริ่มชัดเจนขึ้นหลังเกิด Bullish Divergence และราคาสามารถเบรกเอาท์ขึ้นมาได้ พร้อมทั้งมีการยกโลว์ (Higher Low) เพื่อเปลี่ยนโครงสร้างเป็นแนวโน้มขาขึ้น โดยจากการวัด Fibo Projection มองแนวต้านเป้าหมายถัดไปอยู่ที่ 31.35
- Support Level (แนวรับ): 31.08
- Target (เป้าหมาย): 31.35
- Stop Loss (คัท): 31.07
EURTHB
Market Analysis: While the weakening Baht provides some support for EURTHB, the Euro itself remains under pressure. The EURUSD pair is trending lower, indicating that the Euro is currently weaker than the US Dollar. Furthermore, European 10-year bond yields have dropped to 2.75%, forming a “Double Top” pattern. However, if the Baht continues to weaken and the Euro begins to stabilize, we could see a strong upward rally in EURTHB this week.
EURTHB เริ่มได้รับแรงหนุนจากการอ่อนค่าของเงินบาท อย่างไรก็ตาม ยูโรยังคงอ่อนแอเมื่อเทียบกับดอลลาร์ (EURUSD ปรับตัวลง) ขณะที่อัตราผลตอบแทนพันธบัตรยุโรปอายุ 10 ปี ปรับตัวลดลงสู่ระดับ 2.75% พร้อมเกิดรูปแบบ Double Top ทั้งนี้ หากเงินบาทยังมีทิศทางอ่อนค่าต่อเนื่องและยูโรเริ่มมีการฟื้นตัว อาจส่งผลให้ EURTHB ปรับตัวขึ้นแรงในสัปดาห์นี้
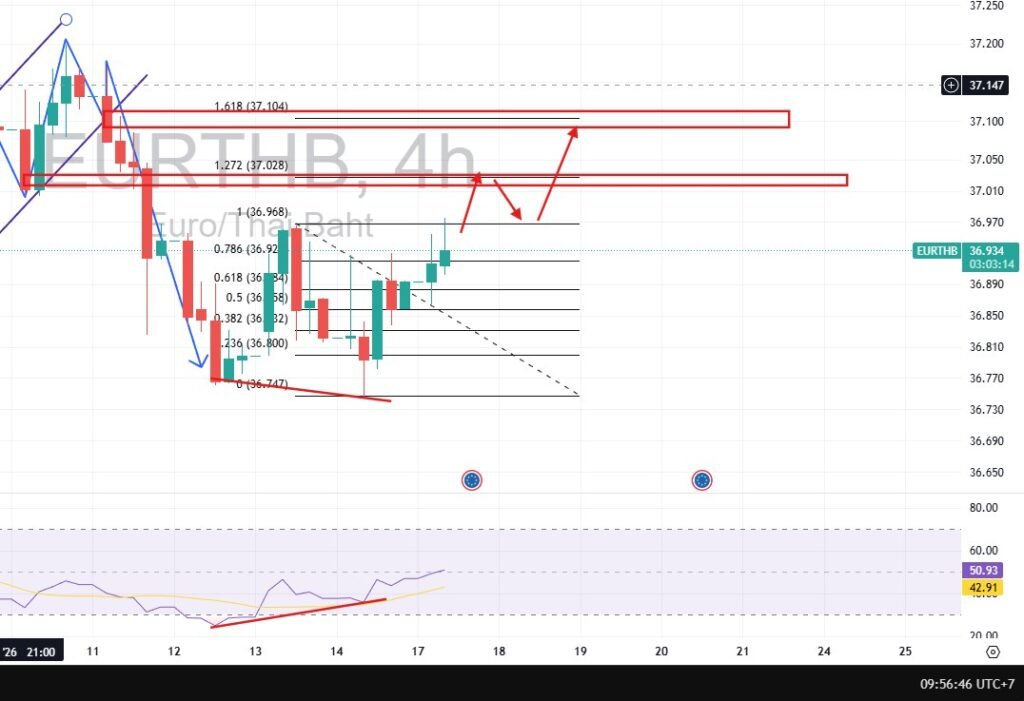
Technical Outlook: Technical indicators show a Bullish Divergence. Fibonacci Retracement levels suggest potential retest targets at 37.02 and 37.10. It is crucial for the price to maintain its position above the 36.83 support level to preserve this recovery momentum.
ทางเทคนิคเริ่มเห็นสัญญาณ Bullish Divergence โดยจากการวัด Fibo Retracement มองเป้าหมายการรีเทสไว้ที่ 37.02 และ 37.10 ตามลำดับ ในเชิงโครงสร้างราคาชุดนี้ไม่ควรปรับตัวลดลงหลุดแนวรับสำคัญที่ 36.83 เพื่อรักษาโอกาสในการปรับตัวขึ้นต่อ
- Support Level (แนวรับ): 36.83
- Target (เป้าหมาย): 37.02 – 37.10
- Stop Loss (คัท): 36.82
AUD/THB
Market Update: Yesterday’s price action resulted in a “False Breakout” after the price briefly dipped below support before recovering back into its previous consolidation zone. Currently, the AUD continues to trade within a Sideways (SW) range, with the upper boundary at 22.10 and the lower support at 21.92. Despite the recovery, the overall structure remains a “Sideways Down” pattern, indicating that downside risks still outweigh the potential for an upward move.
เมื่อวานนี้เกิดสัญญาณ False Break หลังจากที่ราคาร่วงหลุดกรอบแนวรับลงไปชั่วคราว แต่ปัจจุบันราคาได้ฟื้นตัวกลับมาวิ่งในกรอบ Sideways ได้ตามเดิม โดยมีกรอบบนอยู่ที่ 22.10 และกรอบล่างที่ 21.92 อย่างไรก็ตาม เมื่อพิจารณาจากโครงสร้างหลักที่เป็น Sideways Down ทำให้โอกาสที่จะเกิด Downside ยังคงมีสูงกว่าฝั่งขาขึ้น
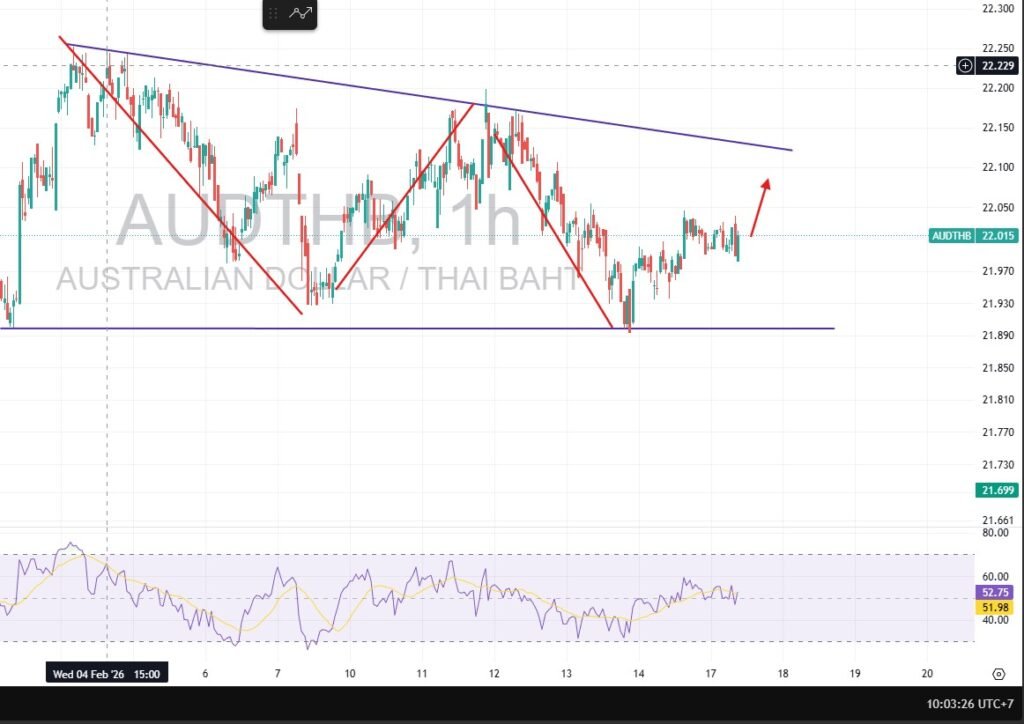
Technical Outlook: The pair is showing a lack of bullish momentum, confined within the 21.92 – 22.10 range. Given the high-risk nature of the current trend, investors are advised to manage their positions carefully and avoid overexposure. Scaling out or reducing position sizes is recommended, as the risk-to-reward ratio is currently unfavorable for long-term holding.
ในทางเทคนิค ราคายังคงแกว่งตัวในกรอบ 21.92 – 22.10 แต่เนื่องจากทิศทางหลักยังมีความเสี่ยงทางขาลง จึงแนะนำให้แบ่งไม้ขายลดความเสี่ยงและไม่ควรถือครองในสัดส่วนที่มากเกินไป เนื่องจากความเสี่ยงในปัจจุบันมีมูลค่าสูงกว่าผลตอบแทนที่คาดหวัง
Trading Strategy (กลยุทธ์การเทรด):
- Resistance (กรอบบน): 22.10
- Support (กรอบล่าง): 21.92
- Target (เป้าหมาย): 22.10
- Stop Loss (คัท): 21.92
GBP/THB
Market Analysis: The GBP/THB pair appears to have bottomed out at the 2x Fibonacci extension level, establishing a solid support base at 42.20. Despite thin buying volume in the short term, technical indicators suggest a recovery is underway. Market participants are closely watching the UK Unemployment Rate data released at 2:00 PM (GMT+7), which is expected to remain steady at 5.1%. Stability in the labor market could provide the necessary catalyst for the Pound to gain traction against the Baht.
วิเคราะห์ตลาด: ค่าเงินปอนด์เทียบกับบาท (GBP/THB) มีแนวโน้มทำจุดต่ำสุดที่ระดับ 2x Fibonacci โดยสามารถสร้างฐานแนวรับที่แข็งแกร่งบริเวณ 42.20 แม้ในระยะสั้นแรงซื้อจะยังดูบางเบา แต่ภาพรวมเริ่มเห็นสัญญาณการฟื้นตัว ทั้งนี้ ตลาดกำลังจับตามองการประกาศอัตราการว่างงานของอังกฤษในช่วงบ่าย 2 โมงวันนี้ ซึ่งคาดการณ์ว่าจะคงที่อยู่ที่ระดับ 5.1% หากตัวเลขออกมาตามเป้าหรือดีกว่าคาด อาจเป็นแรงหนุนให้ค่าเงินปอนด์เริ่มฟื้นตัวเมื่อเทียบกับเงินบาท
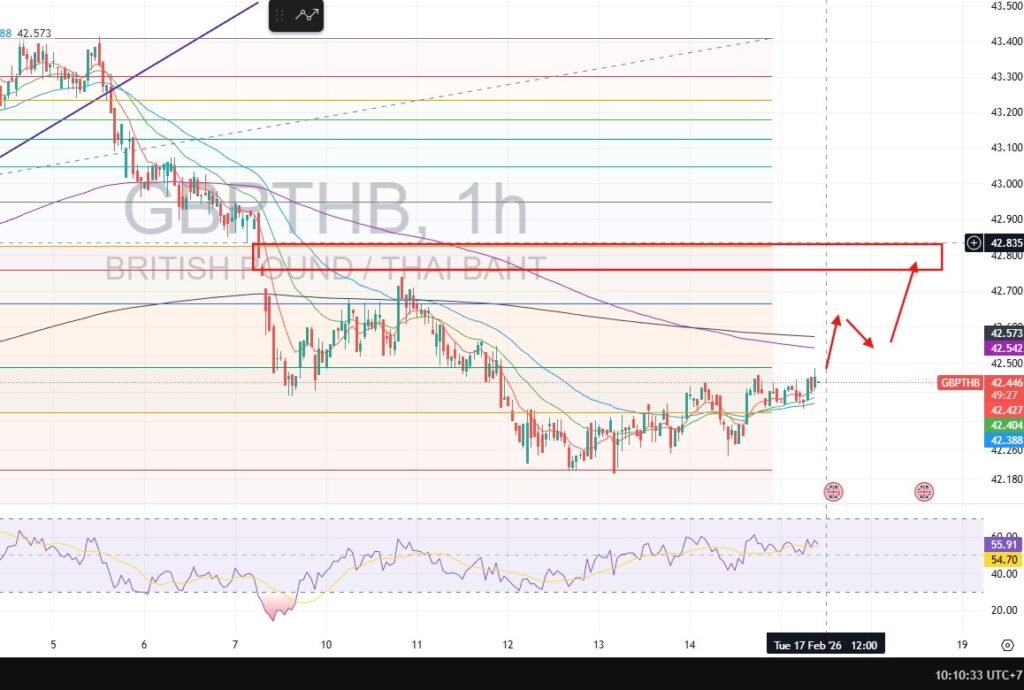
Technical Outlook: The pair is showing signs of a rebound after testing the 42.20 support zone. The RSI has pivoted back toward the Bullish zone, signaling improving momentum. We expect the price to move up to challenge the immediate resistance at 42.54 – 42.58, which aligns with the EMA lines. A successful “Cross Up” above this level could clear the path toward the Fair Value Gap (FVG) at 42.80. This presents a strategic accumulation opportunity for long positions.
มุมมองทางเทคนิค: ราคาสร้างฐานที่แนวรับ 42.20 ได้อย่างมีนัยสำคัญและเริ่มมีการรีบาวด์ ขณะที่เครื่องมือ RSI เริ่มม้วนตัวกลับเข้าสู่โซน Bullish บ่งบอกถึงโมเมนตัมเชิงบวกที่เพิ่มขึ้น มองว่าราคามีโอกาสขึ้นไปทดสอบแนวต้านถัดไปที่ 42.54 – 42.58 เพื่อทดสอบเส้น EMA และหากสามารถเบรกตัว (Cross Up) ขึ้นไปยืนเหนือเส้นค่าเฉลี่ยได้ มีโอกาสปรับตัวขึ้นต่อเนื่องไปยังโซน Fair Value Gap ที่ระดับ 42.80 จึงเป็นจังหวะที่น่าพิจารณาเข้า
Support Level (แนวรับ): 42.20 Resistance Level (แนวต้าน): 42.54 – 42.58
Target (เป้าหมาย): 42.54 – 42.80 Stop Loss (คัท): 42.36
CHF/THB
Market Analysis:The Swiss Franc remains one of the strongest performers in the FX market, trailing only the USD and JPY in relative strength. Currently, the CHF/THB pair is seeing a recovery fueled by the persistent weakness of the Thai Baht. While the Baht faces pressure from capital outflows, the Franc’s safe-haven appeal continues to provide a solid floor for the exchange rate.
คู่เงิน CHF/THB ปรับตัวฟื้นตัวขึ้นโดยมีปัจจัยหนุนหลักมาจากค่าเงินบาทที่ยังคงอยู่ในโทนอ่อนค่า ขณะที่เงินสวิสฟรังก์ (CHF) ยังคงรักษาฐานะสกุลเงินที่แข็งค่าเป็นอันดับต้นๆ โดยเป็นรองเพียง USD และ JPY เท่านั้น ปัจจัยหนุนเหล่านี้ส่งผลให้ราคาสามารถยืนระยะและฟื้นตัวขึ้นได้ในช่วงนี้
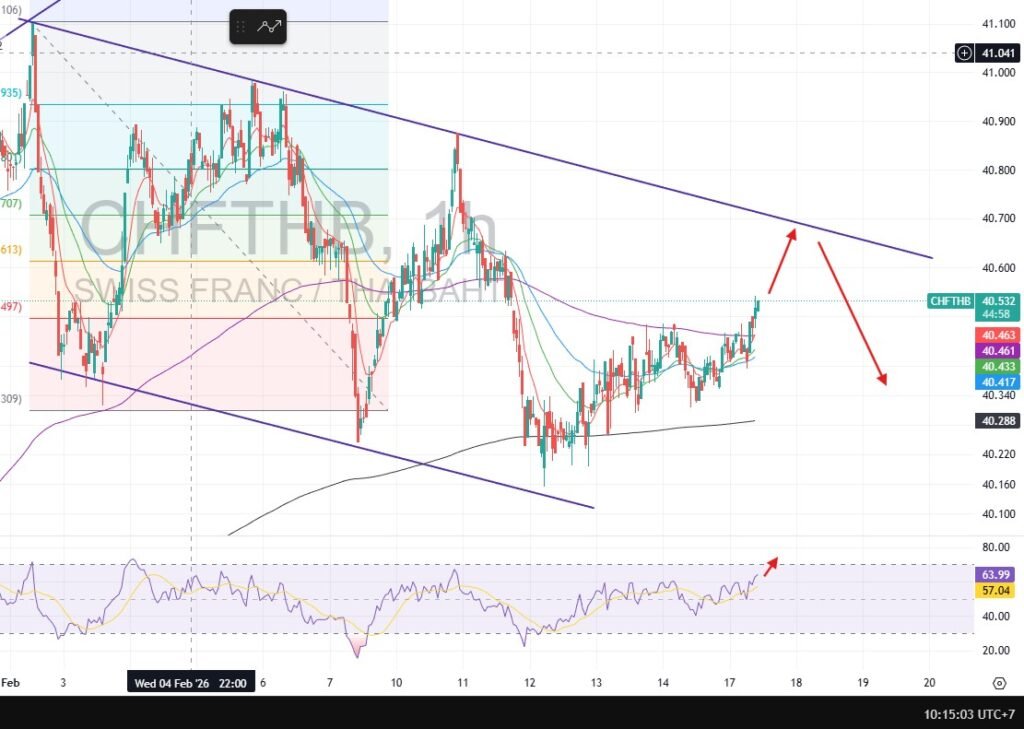
Technical Outlook: In the broader timeframe, the price is still navigating within a Sideways Down channel. However, we are seeing a short-term recovery after the price bounced off the Swing Low at 40.20. The pair has successfully crossed above the EMA 200, signaling renewed bullish momentum. We expect the price to continue its push toward the Swing High resistance zone of 40.70 – 40.80, offering a potential upside of approximately 20-30 pips (satang) from current levels.
ในภาพใหญ่ ราคายังคงเคลื่อนไหวในกรอบแนวโน้มขาลง (Sideways Down) อย่างไรก็ตาม ในระยะสั้นมีการฟื้นตัวขึ้นอย่างชัดเจนหลังจากลงไปทดสอบจุดต่ำสุด (Swing Low) ที่บริเวณ 40.20 โดยล่าสุดราคาได้ Cross up เหนือเส้น EMA 200 ขึ้นมาแล้ว ซึ่งถือเป็นสัญญาณบวกที่อาจสร้างแรงส่ง (Momentum) ให้ราคาปรับตัวขึ้นไปทดสอบแนวต้านถัดไปที่บริเวณ Swing High 40.70 – 40.80 หรือมี Upside ประมาณ 20-30 สตางค์
- Resistance Level (แนวต้าน): 40.70 – 40.80. This is the primary target zone for the current recovery phase.
- Support Level (แนวรับ): 40.38 – 40.45. The EMA 200 crossover point now serves as a dynamic support level to maintain the upward bias.
- Target (เป้าหมาย): 40.70 – 40.80
- Stop Loss (คัท): 40.38