
USDTHB
Market Analysis: Last night, the US JOLTS Job Openings came in at 7.618 million, higher than the estimated 6.860 million. This reflects that the US labor market remains stronger than expected, suggesting that the Fed may not rush to cut interest rates, which supports the US dollar in the short term. For today,
USDTHB is expected to fluctuate within a range as the market watches key US economic data tonight, led by the ADP Employment Change (expected at +116,000) and the ISM Services PMI (expected at 53.7). If the figures beat expectations, it will underscore the resilience of the US economy and labor market, likely prompting the Fed to hold rates higher for longer and bolstering the USD. Conversely, weaker-than-expected data could pressure the USD and provide an opportunity for the Baht to strengthen in the short term.
เมื่อคืนนี้ ตัวเลขตำแหน่งงานว่างเปิดใหม่ (JOLTS Job Openings) ของสหรัฐฯ ออกมาที่ 7.618 ล้านตำแหน่ง สูงกว่าที่คาดการณ์ไว้ที่ 6.860 ล้านตำแหน่ง สะท้อนว่าตลาดแรงงานสหรัฐฯ ยังคงแข็งแกร่งกว่าที่ตลาดประเมินไว้ ส่งผลให้ Fed อาจยังไม่เร่งปรับลดอัตราดอกเบี้ย และเป็นปัจจัยหนุนค่าเงินดอลลาร์ในระยะสั้น สำหรับวันนี้ USDTHB มีแนวโน้มผันผวนในกรอบ โดยตลาดจับตาข้อมูลเศรษฐกิจสหรัฐฯ คืนนี้ นำโดย ADP Employment Change ซึ่งคาดว่าจะเพิ่มขึ้น 116,000 ตำแหน่ง และดัชนี ISM Services PMI ที่คาดอยู่ที่ 53.7 หากตัวเลขออกมาสูงกว่าคาด จะสะท้อนว่าเศรษฐกิจและตลาดแรงงานสหรัฐฯ ยังคงแข็งแกร่ง ส่งผลให้ Fed มีแนวโน้มคงอัตราดอกเบี้ยในระดับสูงเป็นเวลานานขึ้น และเป็นปัจจัยสนับสนุนค่าเงินดอลลาร์ อย่างไรก็ตาม หากข้อมูลออกมาอ่อนแอกว่าคาด อาจเพิ่มแรงกดดันต่อ USD และเปิดโอกาสให้เงินบาทแข็งค่าขึ้นในระยะสั้นได้
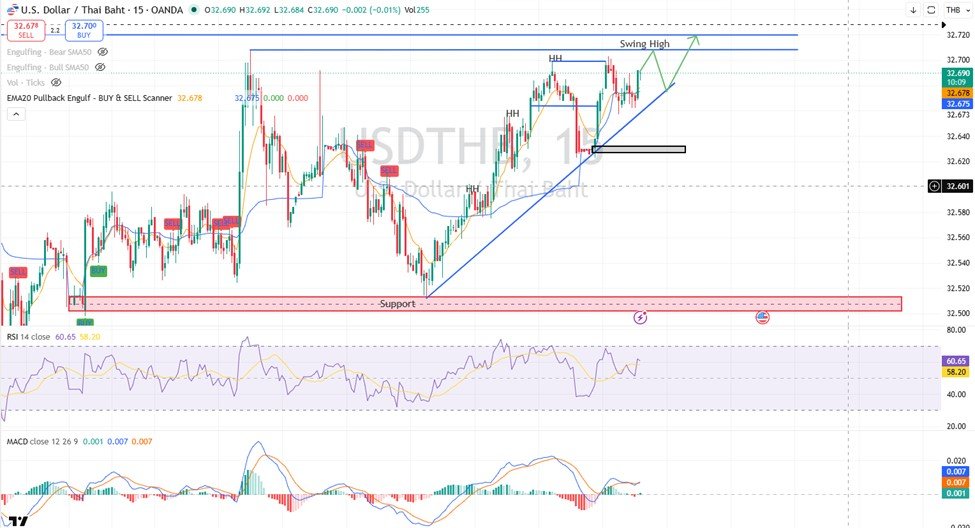
Technical Outlook: On the 4-hour timeframe (4H), the overall picture remains a Sideway Up structure. In the short term, the price continues to form a “Higher Low” pattern and remains above the EMA lines. Meanwhile, the RSI is holding above 50, indicating that buying pressure still maintains an advantage. Although the MACD is in positive territory, the Histogram has started to flatten, suggesting the price has a chance to follow the trend and retest the resistance zone at 32.72–32.74. However, the risk remains within the sideway boundaries as the bullish Histogram declines, signaling slowing momentum, and the MACD lines lean toward a bearish crossover. A break below the uptrend line could trigger a pullback to test the support at 32.63–32.62.
ภาพรวมใน Timeframe 4H ยังคงเป็นลักษณะ Sideway Up โดยในระยะสั้น ราคาสร้างโครงสร้าง Higher Low อย่างต่อเนื่องและยังเคลื่อนไหวเหนือเส้น EMA ขณะที่ RSI อยู่เหนือระดับ 50 สะท้อนว่าแรงซื้อยังคงได้เปรียบในระยะสั้น ส่วน MACD แม้ยังอยู่ในแดนบวก แต่ Histogram เริ่มทรงตัว ทำให้มีโอกาสที่ราคาจะวิ่งตามเทรนด์ขึ้นไปทดสอบแนวต้านที่ 32.72–32.74 อีกครั้ง อย่างไรก็ตาม ความเสี่ยงคือราคายังเคลื่อนไหวในกรอบ Sideway โดย Histogram ฝั่งซื้อเริ่มปรับตัวลดลง สะท้อนว่าโมเมนตัมการปรับตัวขึ้นเริ่มชะลอตัวลง ขณะที่เส้น MACD มีแนวโน้มตัดลง ซึ่งหากราคาหลุดเส้น Trendline ขาขึ้น มีโอกาสย่อตัวลงเพื่อทดสอบแนวรับบริเวณ 32.63–32.62 อีกครั้ง
- Support Level (แนวรับ): 32.63 – 32.62
- Target (เป้าหมาย): 32.72 – 32.74
- Stop Loss (คัท): 32.61
EURTHB
Market Analysis: EURTHB is likely to weaken or move within a tight range after Eurozone inflation for May slowed down. The headline CPI came in at 3.0%, below the 3.2% forecast, while the Core CPI hit 2.2%, lower than the 2.4% expectation. This indicates easing price pressures, fueling expectations that the ECB may adopt a more dovish monetary policy stance ahead, which acts as a drag on the Euro. For today, the market is focusing on the Eurozone Services PMI (expected at 46.4) and the Composite PMI (expected at 47.5)—both remaining below the 50 threshold, signaling economic contraction. The Eurozone Producer Price Index (PPI) is also in focus; weaker data could add further pressure on the Euro due to increased room for ECB easing. Conversely, better-than-expected data could limit the Euro’s short-term downside.
EURTHB มีแนวโน้มอ่อนค่าหรือเคลื่อนไหวในกรอบ หลังตัวเลขเงินเฟ้อยูโรโซนเดือนพฤษภาคมชะลอตัวลง โดย CPI ทั่วไปออกมาที่ 3.0% ต่ำกว่าคาดการณ์ที่ 3.2% ขณะที่ Core CPI อยู่ที่ 2.2% ต่ำกว่าคาดที่ 2.4% สะท้อนว่าแรงกดดันด้านราคากำลังผ่อนคลายลง ซึ่งเพิ่มความคาดหวังว่า ECB อาจดำเนินนโยบายการเงินแบบผ่อนคลายมากขึ้นในระยะข้างหน้า และเป็นปัจจัยกดดันค่าเงินยูโร สำหรับวันนี้ ตลาดจับตาการประกาศดัชนี PMI ภาคการบริการของยูโรโซนที่คาดการณ์อยู่ที่ 46.4 และดัชนี PMI รวมที่คาดการณ์อยู่ที่ 47.5 ซึ่งยังต่ำกว่าระดับ 50 สะท้อนว่ากิจกรรมทางเศรษฐกิจยังอยู่ในภาวะหดตัว รวมถึงดัชนีราคาผู้ผลิต (PPI) ของยูโรโซน หากออกมาต่ำกว่าคาด อาจเพิ่มแรงกดดันต่อค่าเงินยูโรจากการคาดการณ์ว่า ECB จะมีพื้นที่ในการผ่อนคลายนโยบายการเงินมากขึ้น อย่างไรก็ตาม หากตัวเลขเศรษฐกิจออกมาดีกว่าคาด อาจช่วยจำกัดแรงอ่อนค่าของ EUR ในระยะสั้นได้
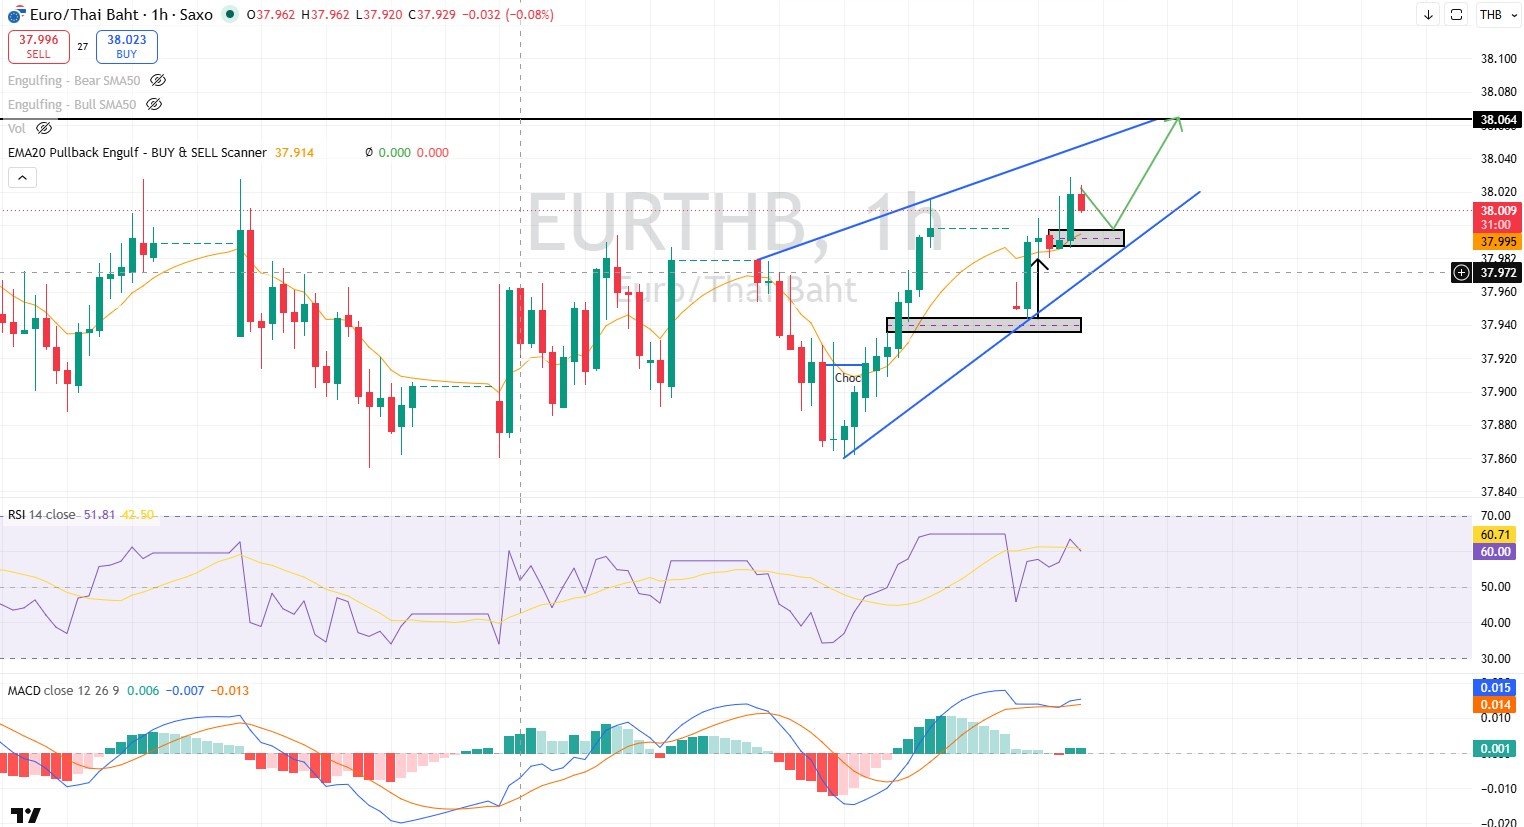
Technical Outlook: On the 4-hour timeframe (4H), the overall structure exhibits a Sideway Up pattern, maintaining an uptrend in the short term. The price is trading above the EMA lines and sustaining its “Higher Low” structure. The RSI remains above 50 and the MACD hovers in positive territory, confirming that bulls retain control for now, which opens the door for a retest of the resistance near 38.06. On the risk side, despite the short-term bullishness, the RSI is approaching the overbought zone while upward momentum shows signs of exhaustion. If the price breaks below the uptrend line and fails to hold above the EMAs, selling pressure could drag it down to test the support level at 37.97.
ภาพรวมใน Timeframe 4H มีลักษณะเป็น Sideway Up โดยในระยะสั้นยังคงอยู่ในแนวโน้มขาขึ้น ราคาเคลื่อนไหวเหนือเส้น EMA และยังรักษาโครงสร้าง Higher Low ได้ต่อเนื่อง ขณะที่ RSI อยู่เหนือระดับ 50 และ MACD ยังคงเคลื่อนไหวในแดนบวก สะท้อนว่าแรงซื้อยังคงได้เปรียบในระยะสั้น ทำให้มีโอกาสที่ราคาจะปรับตัวขึ้นทดสอบแนวต้านบริเวณ 38.06 อีกครั้ง ส่วนความเสี่ยงแม้ว่าภาพรวมระยะสั้นยังเป็นบวก แต่ RSI เริ่มปรับตัวเข้าใกล้โซน Overbought ขณะที่โมเมนตัมการปรับตัวขึ้นเริ่มชะลอลง หากราคาหลุดเส้น Trendline ขาขึ้นและไม่สามารถยืนเหนือเส้น EMA ได้ อาจเห็นแรงขายกดดันให้ราคย่อตัวลงทดสอบแนวรับบริเวณ 37.97 อีกครั้ง
- Support Level (แนวรับ): 37.97
- Target (เป้าหมาย): 38.06
- Stop Loss (คัท): 37.95
AUDTHB
Market Analysis: Today, AUDTHB is poised for volatile trading with a bearish bias after Australia’s Q1 GDP grew by just 0.3% QoQ, missing the 0.5% forecast and slowing down significantly from the previous quarter’s 0.9%. On a YoY basis, GDP came in at 2.5%, below the 2.7% estimate, indicating that the Australian economy is growing softer than anticipated, which might temper expectations for further RBA hawkishness. Furthermore, Australia’s Services and Composite PMIs landed at 48.7; though beating expectations, they remain below 50, pointing to economic contraction. However, China’s Caixin Services PMI recorded a strong 54.4 (vs. 52.3 expected), signaling a solid recovery in China’s service sector. This could partially cushion the AUD’s decline, given China’s status as Australia’s primary trading partner.
วันนี้ AUDTHB มีแนวโน้มผันผวนค่อนไปทางอ่อนค่า หลังตัวเลข GDP ไตรมาส 1 ของออสเตรเลียขยายตัวเพียง 0.3% QoQ ต่ำกว่าคาดการณ์ที่ 0.5% และชะลอลงจากไตรมาสก่อนที่ 0.9% ขณะที่ GDP YoY อยู่ที่ 2.5% ต่ำกว่าคาดที่ 2.7% สะท้อนว่าเศรษฐกิจออสเตรเลียยังเติบโตต่ำกว่าที่ตลาดคาดการณ์ไว้ ซึ่งอาจลดแรงสนับสนุนต่อแนวโน้มนโยบายการเงินที่เข้มงวดของ RBA นอกจากนี้ ดัชนี PMI ภาคบริการและ PMI รวมของออสเตรเลียอยู่ที่ 48.7 แม้สูงกว่าคาดการณ์ แต่ยังต่ำกว่าระดับ 50 ซึ่งบ่งชี้ว่ากิจกรรมทางเศรษฐกิจยังอยู่ในภาวะหดตัว อย่างไรก็ตาม ดัชนี Caixin Services PMI ของจีนออกมาที่ 54.4 สูงกว่าคาดการณ์ที่ 52.3 สะท้อนการฟื้นตัวของภาคบริการจีน และอาจช่วยจำกัดแรงอ่อนค่าของ AUD ได้บางส่วน เนื่องจากจีนเป็นคู่ค้ารายสำคัญของออสเตรเลีย
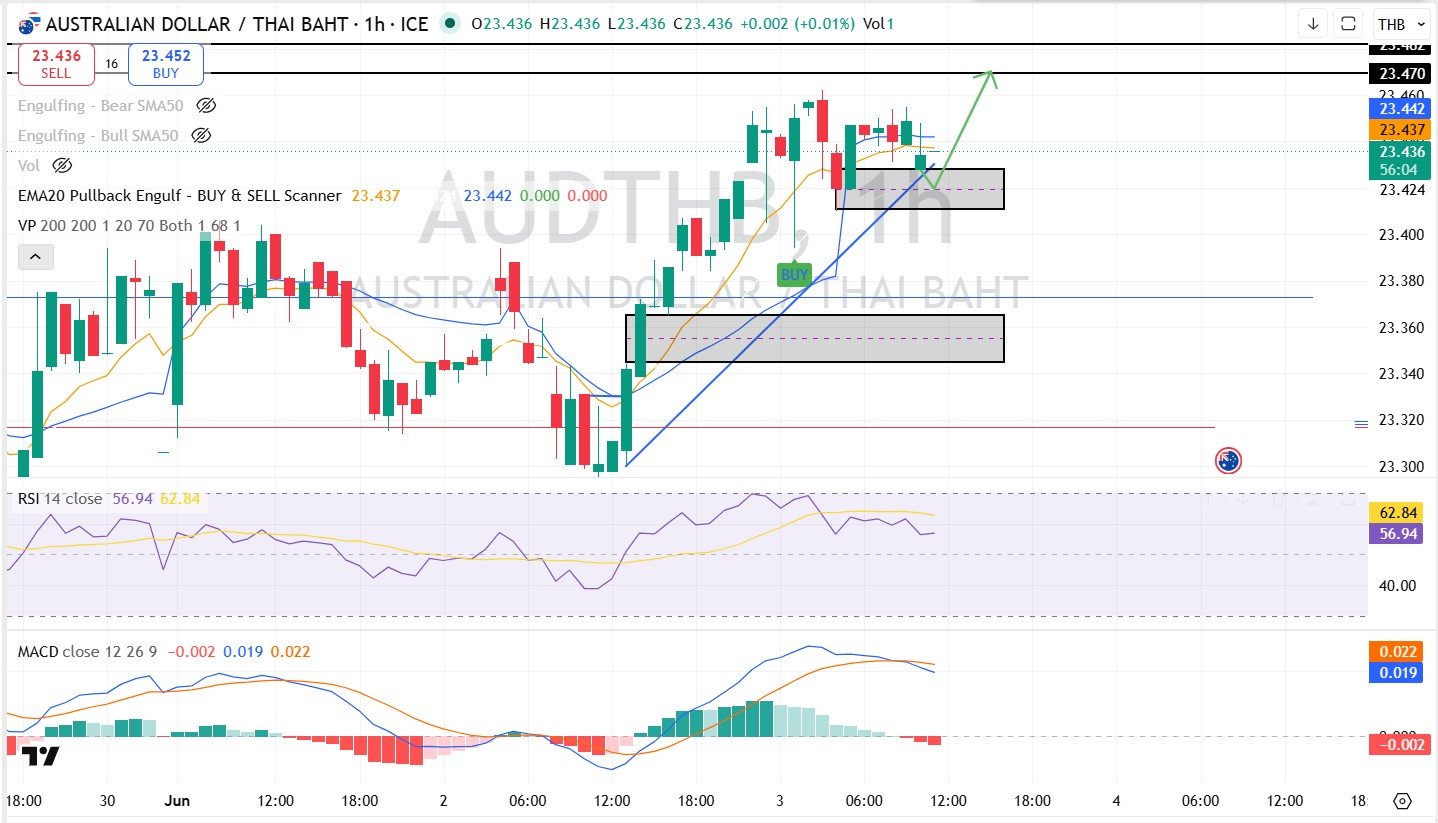
Technical Outlook: On the 4-hour timeframe (4H), the chart presents a Sideway Up structure, keeping its short-term bullish momentum intact. The price is trading above the EMA lines and is currently retracing to test an Order Block zone. With the RSI holding above 50, buyers still have the upper hand; if the price can establish support over this zone, it is likely to climb back up to test the resistance at 23.47–23.48. For the risk factors, the MACD is showing signs of a bearish crossover and the bullish Histogram is shrinking, indicating a loss in upward momentum. If the price fails to defend the Order Block and slides below the EMA lines, it could trigger further liquidations down to the support at 23.41–23.40.
ภาพรวมกราฟใน Timeframe 4H มีลักษณะ Sideway Up โดยในระยะสั้นยังคงอยู่ในแนวโน้มขาขึ้น ราคาเคลื่อนไหวเหนือเส้น EMA และกำลังย่อตัวกลับมาทดสอบบริเวณ Order Block ขณะที่ RSI ยังคงอยู่เหนือระดับ 50 สะท้อนว่าแรงซื้อยังได้เปรียบในระยะสั้น หากสามารถยืนเหนือโซนดังกล่าวได้ มีโอกาสที่ราคาจะปรับตัวขึ้นทดสอบแนวต้านบริเวณ 23.47–23.48 อีกครั้ง ส่วนความเสี่ยงแม้ว่าภาพรวมยังเป็นบวก แต่ MACD เริ่มมีแนวโน้มตัดลง ขณะที่ Histogram ฝั่งซื้อปรับตัวลดลง สะท้อนว่าโมเมนตัมขาขึ้นเริ่มชะลอตัว หากราคาหลุดบริเวณ Order Block และไม่สามารถยืนเหนือเส้น EMA ได้ อาจเห็นแรงขายกดดันให้ราคาย่อตัวลงทดสอบแนวรับบริเวณ 23.41–23.40 อีกครั้ง
- Support Level (แนวรับ): 23.41 – 23.40
- Target (เป้าหมาย): 23.47 – 23.48
- Stop Loss (คัท): 23.38
GBPTHB
Market Analysis: GBPTHB is expected to trade within a range today. At 15:30, the UK Services PMI is projected to cross at 47.9; remaining under the 50 mark, it reflects ongoing economic strain in the services sector. Although UK inflation remains elevated, cooling economic data may prompt market participants to pare back bets on additional BoE rate hikes, leaving the Pound Sterling lacking short-term bullish catalysts.
GBPTHB มีแนวโน้มเคลื่อนไหวในกรอบ โดยเวลา 15.30 น. ดัชนี PMI ภาคบริการของอังกฤษ คาดการณ์อยู่ที่ 47.9 ซึ่งต่ำกว่าระดับ 50 สะท้อนภาคบริการยังเผชิญแรงกดดันทางเศรษฐกิจ แม้เงินเฟ้อของอังกฤษยังอยู่ในระดับสูง แต่ข้อมูลเศรษฐกิจที่ชะลอตัวอาจทำให้ตลาดลดการคาดการณ์การขึ้นดอกเบี้ยเพิ่มเติมของ BoE ส่งผลให้ค่าเงินปอนด์ยังขาดปัจจัยบวกในระยะสั้น
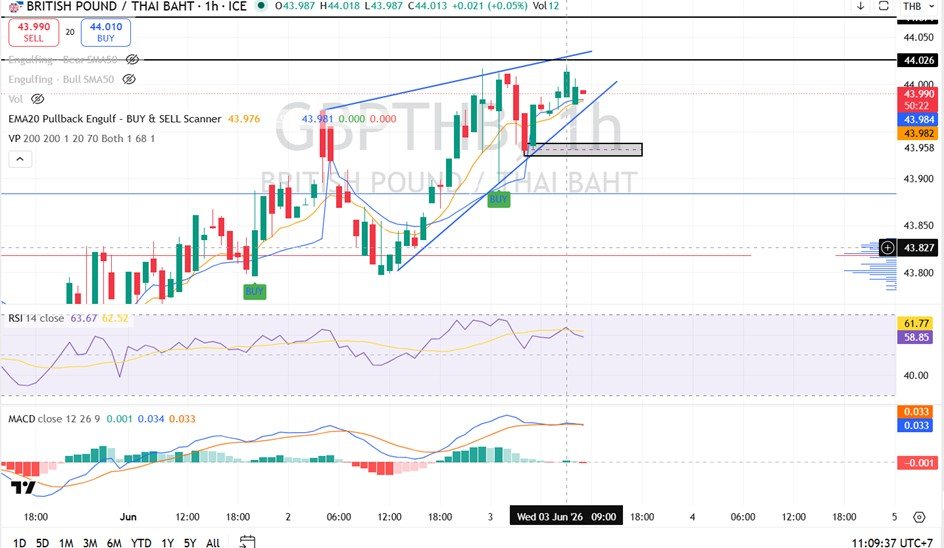
Technical Outlook: On the 4-hour timeframe (4H), the trend demonstrates a Sideway Up behavior, indicating an intact short-term uptrend. The price action remains supported above both the EMA lines and the ascending Trendline. With the RSI holding above 50, buying momentum remains dominant. The MACD stays in positive territory, though its momentum has begun to flatten, leaving room for the price to push higher and test the resistance zone at 44.02–44.04. However, the immediate risk shows the RSI softening from overextended levels alongside a steadily declining MACD Histogram. A breakdown below the trendline and the EMAs could invite sellers to push the pair down toward the support at 43.96–43.95.
ภาพรวมกราฟใน Timeframe 4H มีลักษณะเป็น Side Way Up โดยในระยะสั้นยังคงอยู่ในแนวโน้มขาขึ้น ราคาเคลื่อนไหวเหนือเส้น EMA และยังสามารถยืนเหนือเส้น Trend Line ได้ ขณะที่ RSI อยู่เหนือระดับ 50 สะท้อนว่าแรงซื้อยังคงได้เปรียบในระยะสั้น ส่วน MACD ยังคงเคลื่อนไหวในแดนบวก แม้โมเมนตัมจะเริ่มชะลอลง ทำให้มีโอกาสที่ราคาจะปรับตัวขึ้นทดสอบแนวต้านบริเวณ 44.02–44.04 อีกครั้ง ส่วนความเสี่ยงแม้ว่าภาพรวมยังเป็นบวก แต่ RSI เริ่มอ่อนตัวลงจากระดับสูง ขณะที่ Histogram ของ MACD ปรับตัวลดลงต่อเนื่อง สะท้อนว่าแรงซื้อเริ่มชะลอตัว หากราคาหลุดเส้น Trend Line ขาขึ้นและไม่สามารถยืนเหนือเส้น EMA ได้ อาจเห็นแรงขายกดดันให้ราคาย่อตัวลงทดสอบแนวรับบริเวณ 43.96–43.95 อีกครั้ง
Stop Loss (คัท): 43.93
Support Level (แนวรับ): 43.96 – 43.95
Target (เป้าหมาย): 44.02 – 44.03
CHFTHB
Market Analysis: CHFTHB shows a steady to strengthening bias as the Swiss Franc continues to draw support from its safe-haven appeal amid global economic uncertainties. Although there are no major Swiss economic releases scheduled for today, any softer-than-expected data from the US or Eurozone could spark renewed safe-haven flows into the CHF. On a broader scale, the Swiss economy remains fundamentally supported by recent robust GDP and retail sales data.
CHFTHB มีแนวโน้มแข็งค่าทรงตัว โดยค่าเงินฟรังก์ยังได้รับแรงหนุนจากสถานะสินทรัพย์ปลอดภัย ท่ามกลางความไม่แน่นอนของเศรษฐกิจโลก แม้ว่าวันนี้จะไม่มีตัวเลขเศรษฐกิจสำคัญจากสวิตเซอร์แลนด์โดยตรง แต่หากข้อมูลเศรษฐกิจสหรัฐฯ หรือยุโรปออกมาอ่อนแอกว่าคาด อาจกระตุ้นแรงซื้อ CHF เพิ่มขึ้น ขณะที่ภาพรวมเศรษฐกิจสวิสยังได้รับแรงสนับสนุนจากข้อมูล GDP และยอดค้าปลีกที่แข็งแกร่งในช่วงที่ผ่านมา
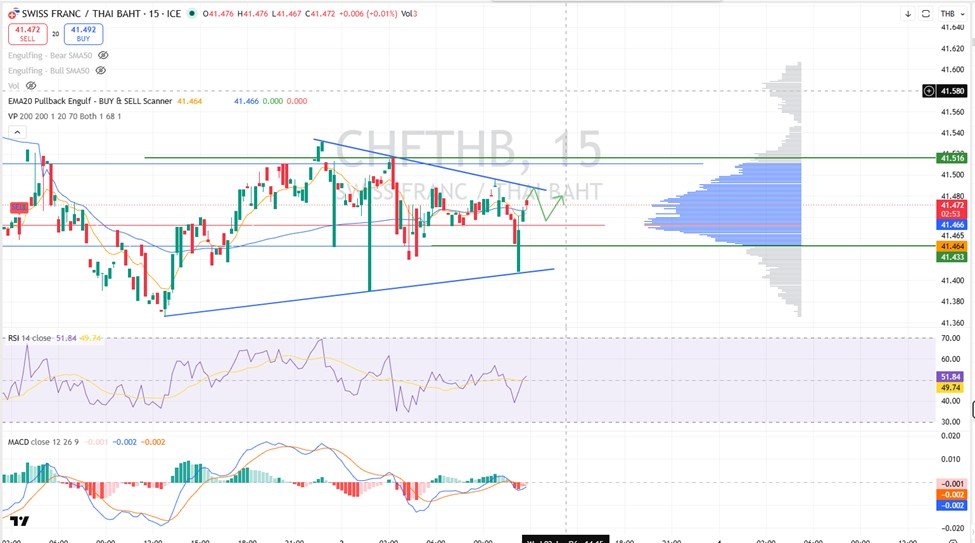
Technical Outlook: On the 4-hour timeframe (4H), the overall market displays a Sideway profile. Nevertheless, short-term price action shows early signs of recovery after successfully reclaiming ground above the EMA lines. The RSI is hovering around the 50 level, indicating a relatively balanced tug-of-war between buyers and sellers. As the MACD points upward and edges closer to a bullish crossover, the price looks set to attempt a move higher to test the resistance level at 41.51–41.52. On the flip side, because the structural trend is still trapped in a sideway range and has yet to break key resistance convincingly, the flat MACD near the zero line implies weak momentum. A failure to hold above the EMAs could cause a drop back to the support area of 41.43–41.44.
ภาพรวมกราฟใน Timeframe 4H มีลักษณะ Side Way อย่างไรก็ตาม ในระยะสั้นเริ่มมีสัญญาณฟื้นตัวหลังสามารถยืนเหนือเส้น EMA ได้ ขณะที่ RSI อยู่บริเวณระดับ 50 สะท้อนว่าแรงซื้อและแรงขายยังค่อนข้างสมดุล ส่วน MACD เริ่มปรับตัวขึ้นและมีโอกาสเกิดสัญญาณตัดขึ้น ทำให้ราคามีโอกาสปรับตัวขึ้นทดสอบแนวต้านบริเวณ 41.51–41.52 อีกครั้ง ส่วนความเสี่ยงคือภาพรวมยังเป็นการเคลื่อนไหวในกรอบ Side Way และราคายังไม่สามารถทะลุแนวต้านสำคัญได้อย่างชัดเจน ขณะที่ MACD ยังคงอยู่ใกล้เส้นศูนย์ สะท้อนว่าโมเมนตัมยังไม่แข็งแรงมากนัก หากราคาไม่สามารถยืนเหนือเส้น EMA ได้ อาจเห็นแรงขายกดดันให้ราคาย่อตัวลงทดสอบแนวรับที่ 41.43–41.44 อีกครั้ง
- Support Level (แนวรับ): 41.43 – 41.44
- Target (เป้าหมาย): 41.51 – 41.52
- Stop Loss (คัท): 41.42
https://th.tradingview.com/u/Soponwit_AISA_MSc/