

USDTHB
Market Analysis: The USD weakened by around 16 pips following reports that the U.S. and Iran have reached a peace agreement, easing geopolitical tensions. Additionally, the Strait of Hormuz is prepared to resume normal operations this Friday, which helps alleviate global energy supply concerns and pressures the U.S. dollar in the short term. Tonight, investors are keeping a close eye on key U.S. economic data, including the Empire State Manufacturing Index (19:30), Industrial Production (20:15),
and the NAHB Housing Market Index (21:00). Better-than-expected figures could signal U.S. economic resilience and support a short-term USD rebound. However, the most critical catalyst remains the FOMC meeting on June 17, where market participants will scrutinize the interest rate decision and Fed commentary to gauge monetary policy direction for the second half of the year.
เงินดอลลาร์สหรัฐ (USD) อ่อนค่าลงราว 16 จุด หลังมีรายงานว่าสหรัฐฯ และอิหร่านสามารถบรรลุข้อตกลงสันติภาพได้ ส่งผลให้ความกังวลด้านภูมิรัฐศาสตร์ลดลง ขณะที่ช่องแคบฮอร์มุซเตรียมกลับมาเปิดดำเนินการตามปกติในวันศุกร์นี้ ซึ่งช่วยคลายความกังวลต่ออุปทานพลังงานโลก และกดดันค่าเงินดอลลาร์ในระยะสั้น สำหรับคืนนี้ ตลาดจับตาข้อมูลเศรษฐกิจสหรัฐฯ หลายรายการ ได้แก่ Empire State Manufacturing Index เวลา 19:30 น., Industrial Production เวลา 20:15 น. และ NAHB Housing Market Index เวลา 21:00 น. หากตัวเลขออกมาดีกว่าคาด จะสะท้อนว่าเศรษฐกิจสหรัฐฯ ยังคงแข็งแกร่ง และอาจช่วยหนุนให้ USD รีบาวด์ได้ในระยะสั้น อย่างไรก็ตาม ปัจจัยสำคัญที่สุดยังคงอยู่ที่การประชุม FOMC วันที่ 17 มิถุนายนนี้ ซึ่งนักลงทุนจะจับตาทั้งการตัดสินใจเรื่องอัตราดอกเบี้ยและถ้อยแถลงของ Fed เพื่อประเมินทิศทางนโยบายการเงินในช่วงครึ่งหลังของปี
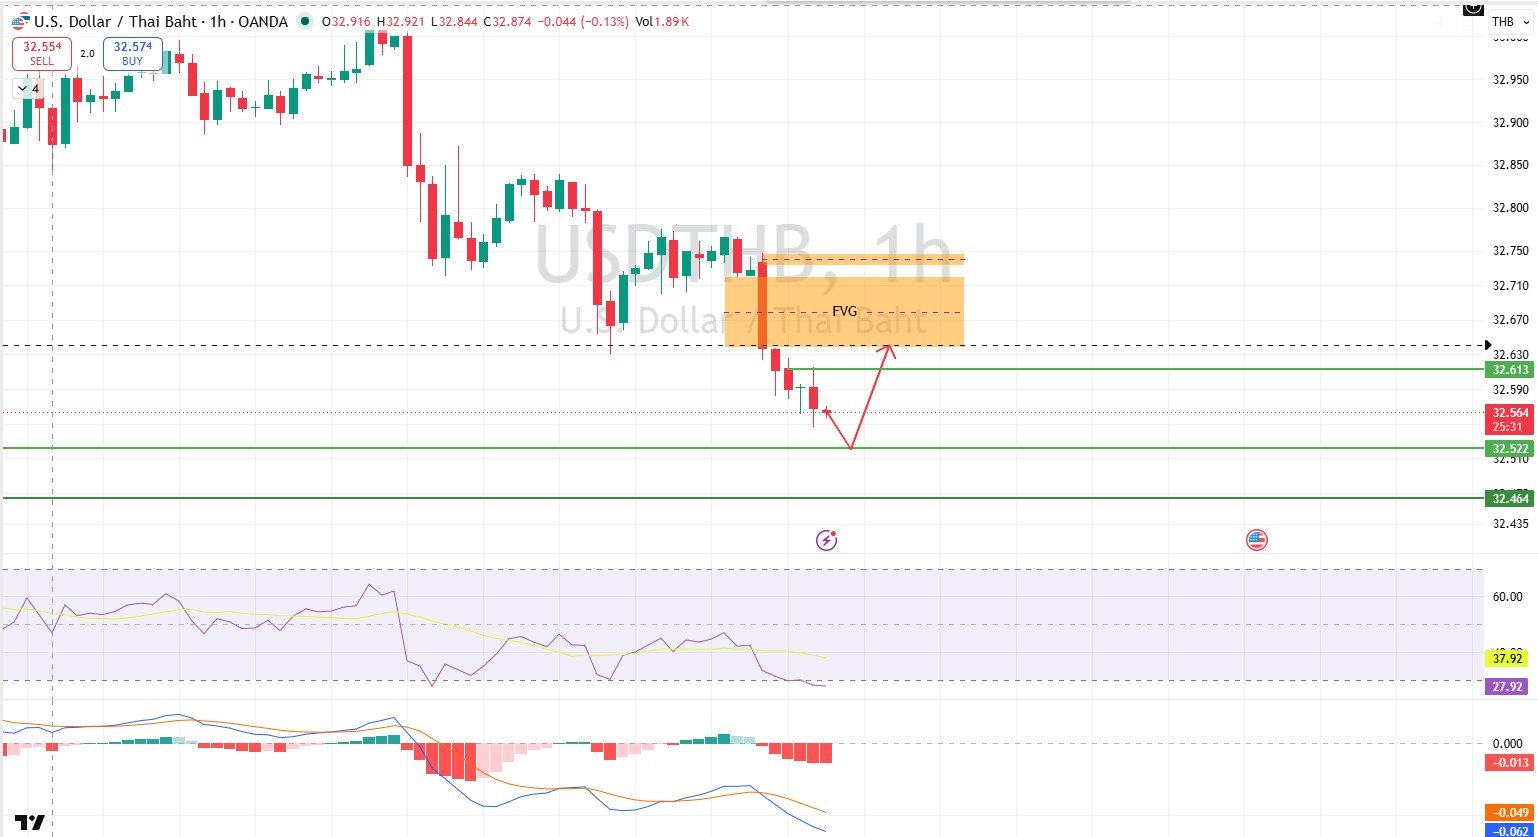
Technical Outlook: On the 4-hour timeframe (4H), the overall structure exhibits a downtrend after breaking below the previous sideways range, continuing to form Lower Highs and Lower Lows. Recently, the price has approached a key support level near 32.52. The RSI is hovering near the oversold zone, while the MACD remains below the signal line with a negative histogram, indicating that the sellers still hold the advantage. However, there is a possibility of a short-term rebound to fill the Fair Value Gap (FVG) area between 32.63 and 32.72, provided that the 32.52 support level holds.
ภาพรวมกราฟใน Time Frame 4H มีลักษณะเป็นเทรนด์ขาลง หลังราคาหลุดโครงสร้าง Side Way เดิมลงมาและทำ Lower High – Lower Low ต่อเนื่อง โดยล่าสุดราคาเริ่มเข้าใกล้แนวรับสำคัญบริเวณ 32.52 ขณะที่ RSI ปรับตัวลงใกล้โซน Oversold และ MACD ยังคงอยู่ต่ำกว่าเส้น Signal พร้อม Histogram ติดลบ สะท้อนว่าโมเมนตัมฝั่ง Sell ยังได้เปรียบ อย่างไรก็ตาม มีโอกาสเกิดแรงรีบาวด์ระยะสั้นเพื่อกลับขึ้นไปปิดช่องว่างราคา (FVG) บริเวณ 32.63–32.72 หากแนวรับ 32.52 ยังสามารถรับอยู่ได้
- Support Level (แนวรับ): 32.52
- Target (เป้าหมาย): 32.61 – 32.63
- Stop Loss (คัท): 32.51
EURTHB
Market Analysis: EURTHB dropped by 10 pips at the market open due to the peace agreement between the U.S. and Iran. If the Thai stock market opens in the negative territory today, it could provide short-term support for EURTHB. Today, investors are closely monitoring Christine Lagarde’s speech; a continued hawkish stance or concerns over inflationary pressures could support the Euro. Additionally, the Eurozone Trade Balance and Industrial Production data for April will be released at 16:00, reflecting the European economic recovery. Better-than-expected data could further boost the EUR in the short term. However, if the USD strengthens on expectations that the Fed will maintain high interest rates, it could limit the upside for EUR and EURTHB.
EURTHB เปิดตลาดร่วงลงถึง 10 จุด เนื่องจากสหรัฐฯ และอิหร่านสามารถบรรลุข้อตกลงสันติภาพได้ ถ้าหากหุ้นไทยวันนี้เปิดตลาดลบ อาจสนับสนุน EURTHB ได้ในระยะสั้น โดยวันนี้ นักลงทุนจับตาถ้อยแถลงของ Christine Lagarde อย่างใกล้ชิด หากยังคงส่งสัญญาณ Hawkish หรือแสดงความกังวลต่อแรงกดดันเงินเฟ้อ อาจช่วยพยุงค่าเงินยูโรได้ นอกจากนี้ เวลา 16:00 น. จะมีการประกาศตัวเลขดุลการค้า และดัชนีภาคการผลิตอุตสาหกรรม ของยูโรโซน ประจำเดือนเมษายน ซึ่งจะสะท้อนภาพรวมการฟื้นตัวของเศรษฐกิจยุโรป หากตัวเลขออกมาดีกว่าคาด อาจเป็นปัจจัยหนุน EUR เพิ่มเติมในระยะสั้น อย่างไรก็ตาม หาก USD กลับมาแข็งค่าจากการคาดการณ์ว่า Fed จะคงอัตราดอกเบี้ยในระดับสูงต่อไป ก็อาจจำกัดการปรับตัวขึ้นของ EUR และ EURTHB ได้เช่นกัน
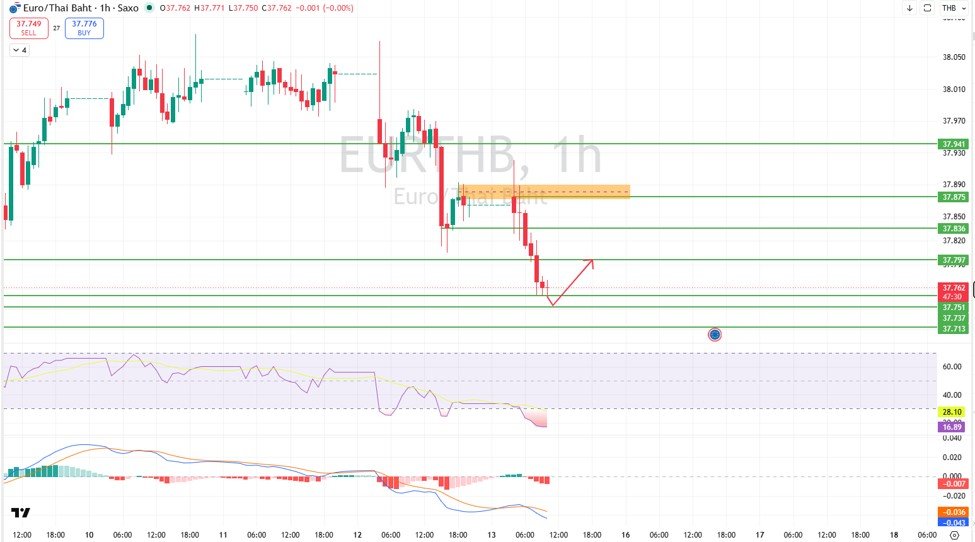
Technical Outlook: On the 4-hour timeframe (4H), the overall EURTHB chart shows a sideways pattern, but the short-term trend remains bearish after breaking below key support levels at 37.87 and 37.84. The price continues to trade below major moving averages, indicating that selling pressure dominates in the near term. The RSI has dropped to around 28, entering the oversold territory, which implies the asset is oversold and a technical rebound is likely. The MACD remains in negative territory, though selling momentum has begun to decelerate. If the price can sustain above the 37.74 support level, a technical rebound could occur, and with the Thai stock market opening positive today, the price may test the resistance zone at 37.79 – 37.84 in the short term.
ภาพรวมกราฟ EURTHB ใน Time Frame 4H มีลักษณะ Side Way แต่ในระยะสั้นราคายังคงอยู่ในแนวโน้มขาลง หลังราคาหลุดแนวรับสำคัญบริเวณ 37.87 และ 37.84 ลงมาอย่างต่อเนื่อง ขณะที่ราคาเคลื่อนไหวต่ำกว่าเส้นค่าเฉลี่ยหลัก สะท้อนว่าแรงขายยังคงได้เปรียบในระยะสั้น ด้าน RSI ปรับตัวลงสู่บริเวณ 28 ซึ่งเข้าใกล้เขต Oversold บ่งชี้ว่าราคาเริ่มอยู่ในภาวะขายมากเกินไป และมีโอกาสเกิดแรงรีบาวด์ทางเทคนิคได้ ขณะที่ MACD ยังคงอยู่ในแดนลบ แม้โมเมนตัมฝั่งขายจะเริ่มชะลอลงบ้าง หากราคาสามารถยืนเหนือแนวรับบริเวณ 37.74 ได้ มีโอกาสเกิด Technical Rebound รวมถึงวันนี้ตลาดหุ้นไทยเปิดบวก มีโอกาสทำให้ราคาขึ้นทดสอบแนวต้านบริเวณ 37.79 – 37.84 ในระยะสั้น
- Support Level (แนวรับ): 37.74 – 37.71
- Target (เป้าหมาย): 37.79 – 37.84
- Stop Loss (คัท): 37.70
AUDTHB
Market Analysis: The AUD has a strong potential to outperform other currencies today as the U.S.-Iran peace agreement fosters a risk-on market sentiment, which supports the Aussie. Indirect support also comes from South Korea’s export growth of 53.4%, beating expectations and reflecting robust regional demand and economic activity in Asia. This serves as a positive driver for growth-linked and commodity currencies like the AUD. Nonetheless, the trajectory of AUDTHB tonight will heavily depend on U.S. economic data, particularly the Empire State Manufacturing Index and Industrial Production. Stronger-than-expected data could bolster the greenback and put downward pressure on the AUD.
AUDTHB วันนี้มีโอกาสแข็งค่ากว่าสกุลเงินอื่นเนื่องจากสหรัฐฯ และอิหร่านสามารถบรรลุข้อตกลงสันติภาพได้ทำให้ตลาดเปิดรับความเสี่ยงมากขึ้น อาจสนับสนุน AUD ได้ โดยปัจจัยอ้อมได้รับแรงสนับสนุนจากตัวเลขการส่งออกของเกาหลีใต้ที่ขยายตัว 53.4% สูงกว่าคาดการณ์ สะท้อนว่าอุปสงค์สินค้าและกิจกรรมทางเศรษฐกิจในภูมิภาคเอเชียยังคงแข็งแกร่ง ซึ่งเป็นปัจจัยบวกต่อสกุลเงินที่อิงการเติบโตและสินค้าโภคภัณฑ์อย่าง AUD อย่างไรก็ตาม ทิศทางของ AUDTHB ในช่วงค่ำจะขึ้นอยู่กับข้อมูลเศรษฐกิจสหรัฐเป็นสำคัญ โดยเฉพาะดัชนีภาคการผลิตเขตรัฐนิวยอร์ก (Empire State Manufacturing) และตัวเลขผลผลิตภาคอุตสาหกรรม (Industrial Production) หากออกมาดีกว่าคาด อาจหนุนค่าเงินดอลลาร์สหรัฐให้แข็งค่าขึ้นและกดดัน AUD ให้อ่อนตัวลงได้
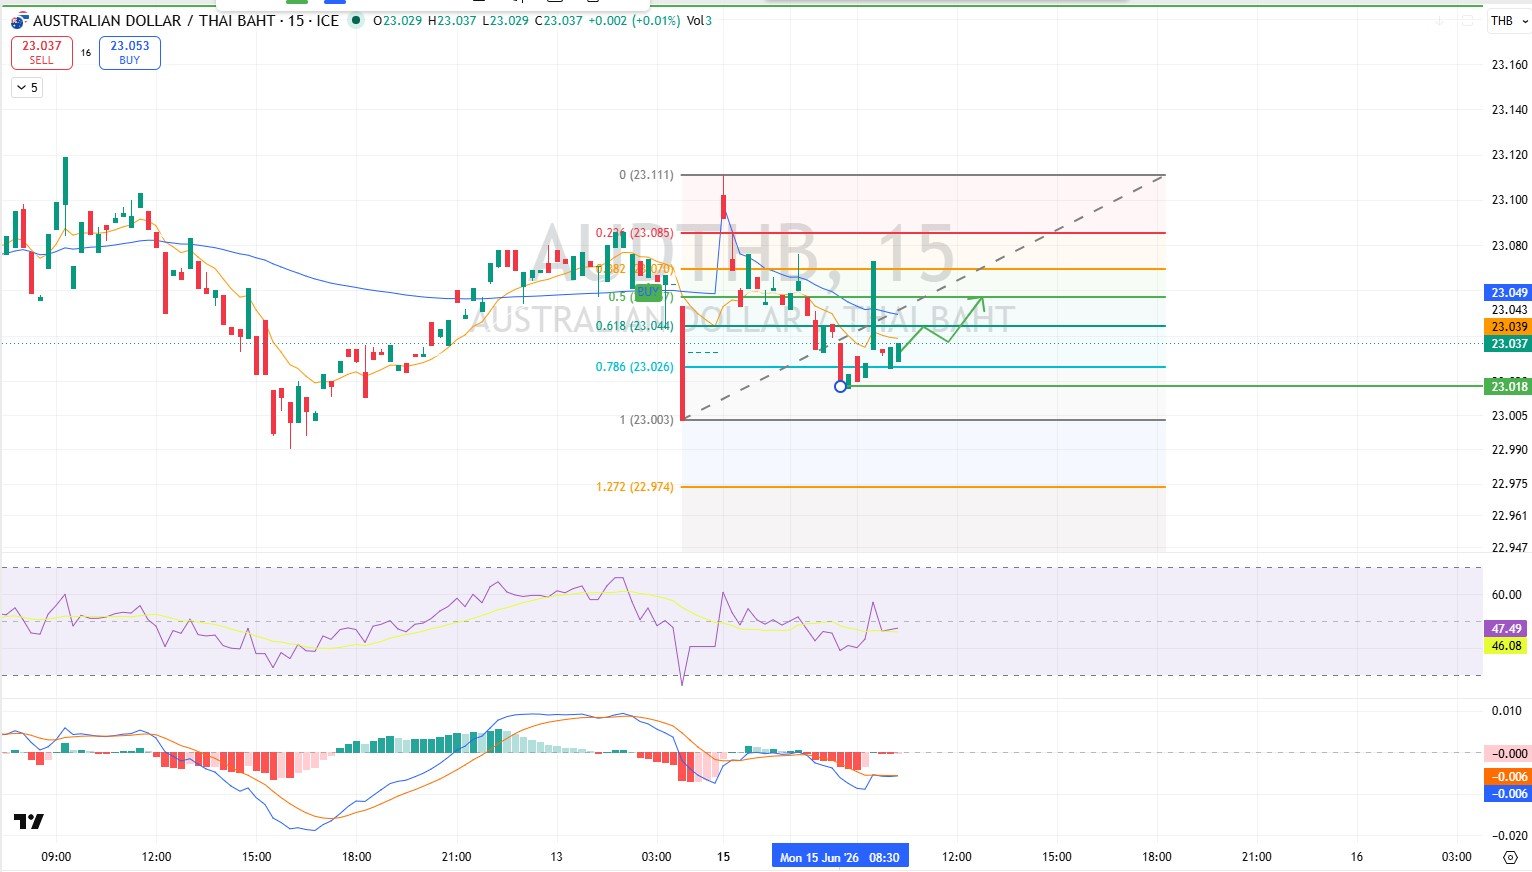
Technical Outlook: On the 4-hour timeframe (4H), the AUDTHB chart exhibits a sideways-down pattern but is showing signs of recovery after consistently holding above the support zone of 23.02 – 23.03. The price is currently moving near the Fibonacci 0.618 level (23.044). Meanwhile, the RSI has climbed back toward 50, indicating easing selling pressure and returning buying momentum. The MACD, despite being below the zero line, has formed a bullish crossover with a shrinking negative histogram, pointing to a potential short-term technical rebound. If the price firmly establishes itself above 23.04, it is likely to test the resistance range of 23.05 – 23.07, and a breakout could expose the next target at 23.08.
ภาพรวมกราฟ AUDTHB ใน Time Frame 4H มีลักษณะ Side Way Down เริ่มมีสัญญาณฟื้นตัวหลังราคาสามารถยืนเหนือแนวรับบริเวณ 23.02 – 23.03 ได้อย่างต่อเนื่อง โดยราคาเคลื่อนไหวใกล้ระดับ Fibonacci 0.618 (23.044) ขณะที่ RSI ปรับตัวขึ้นมาอยู่ใกล้ระดับ 50 สะท้อนว่าแรงขายเริ่มชะลอลง และโมเมนตัมฝั่งซื้อเริ่มกลับเข้ามา ด้าน MACD แม้ยังอยู่ต่ำกว่าเส้นศูนย์ แต่เริ่มตัดขึ้นและ Histogram ฝั่งลบลดลง บ่งชี้ถึงโอกาสเกิด Technical Rebound ในระยะสั้น หากราคาสามารถยืนเหนือ 23.04 ได้อย่างมั่นคง มีโอกาสปรับตัวขึ้นทดสอบแนวต้านบริเวณ 23.05 – 23.07 และหากผ่านได้ มีโอกาสขึ้นต่อไปทดสอบบริเวณ 23.08 ได้ในลำดับถัดไป
- Support Level (แนวรับ): 23.01
- Target (เป้าหมาย): 23.05 – 23.07
- Stop Loss (คัท): 22.99
GBPTHB
Market Analysis: GBPTHB is expected to remain stable to slightly stronger, capitalizing on the weaker USD. Although there are no major economic data releases from the UK today, the Pound is backed by expectations that the Bank of England (BoE) will keep interest rates elevated for longer due to above-target inflation. Nevertheless, the ultimate direction for the Sterling remains dependent on broader global market sentiment and U.S. dollar movements.
GBPTHB มีแนวโน้มทรงตัวถึงแข็งค่าเล็กน้อย จาก USD ที่อ่อนค่าลง แม้วันนี้อังกฤษไม่มีตัวเลขเศรษฐกิจสำคัญ แต่ค่าเงินปอนด์ยังได้รับแรงหนุนจากความคาดหวังว่า BoE จะคงดอกเบี้ยในระดับสูงต่อไป เนื่องจากเงินเฟ้ออังกฤษยังอยู่เหนือเป้าหมาย อย่างไรก็ตาม ทิศทาง GBP ยังคงขึ้นอยู่กับบรรยากาศการลงทุนทั่วโลกและการเคลื่อนไหวของดอลลาร์เป็นหลัก
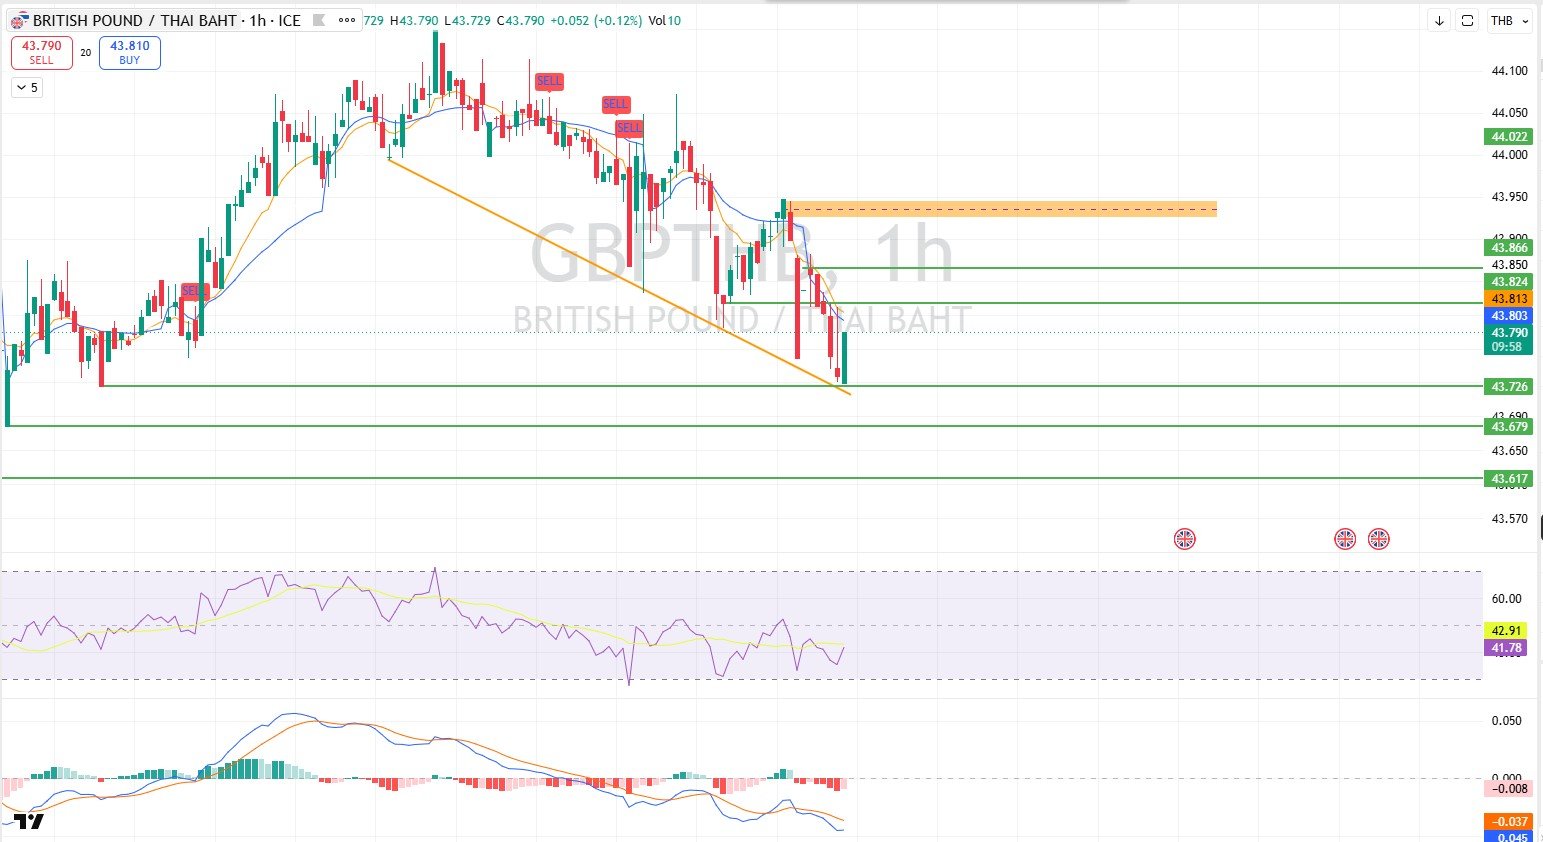
Technical Outlook: On the 4-hour timeframe (4H), the overall GBPTHB chart shows a sideways-up configuration, but the short-term trend has turned bearish after breaking below the main trendline and trading below both short- and medium-term EMAs. However, buying interest has re-emerged near the 43.72 – 43.73 support area, sparking a short-term rebound. The RSI is moving near 40, indicating a slowdown in selling pressure, although a clear bullish reversal has yet to be confirmed. The MACD stays in negative territory, but the histogram is shrinking, signaling fading bearish momentum. Sustained trading above 43.72 could drive the price to test the initial resistance at 43.81, and potentially the key resistance zone at 43.86 in the short term.
ภาพรวมกราฟ GBPTHB ใน Time Frame 4H มีลักษณะ Side Way Up แต่ในระยะสั้นเป็นแนวโน้มขาลง หลังราคาปรับตัวหลุดเส้นแนวโน้มหลักและเคลื่อนไหวต่ำกว่าเส้น EMA ทั้งระยะสั้นและระยะกลาง อย่างไรก็ตาม บริเวณแนวรับ 43.72 – 43.73 เริ่มมีแรงซื้อกลับเข้ามา ทำให้ราคาเกิดการรีบาวด์ระยะสั้น ขณะที่ RSI เคลื่อนไหวใกล้ระดับ 40 สะท้อนว่าแรงขายเริ่มชะลอลง แต่ยังไม่สามารถกลับเข้าสู่ภาวะขาขึ้นได้อย่างชัดเจน ด้าน MACD ยังคงอยู่ในแดนลบ แต่ Histogram เริ่มลดแรงลบลง บ่งชี้ว่าโมเมนตัมฝั่งขายเริ่มอ่อนกำลัง หากราคาสามารถยืนเหนือบริเวณ 43.72 ได้ต่อเนื่อง มีโอกาสฟื้นตัวขึ้นทดสอบแนวต้านแรกบริเวณ 43.81 และหากผ่านได้ อาจขึ้นไปทดสอบโซนแนวต้านสำคัญบริเวณ 43.86 ได้ในระยะสั้น
- Support Level (แนวรับ): 43.68
- Target (เป้าหมาย): 43.81 – 43.86
- Stop Loss (คัท): 43.67
CHFTHB
Market Analysis: With the VIX index at 17.67, the market is not in a distinct risk-off mode, limiting safe-haven inflows into the Swiss Franc (CHF) in the short term as investors maintain moderate risk appetite. Today at 13:30, the market will monitor Switzerland’s monthly PPI (expected at 0.4% vs 0.8% previously) and the SECO Consumer Confidence index (expected to improve to -38 from -40), which points to a gradual domestic recovery. Better-than-expected data could support the CHF and lift CHFTHB. Geopolitically, the peace agreement between the U.S. and Iran may encourage a risk-on environment, which could act as a drag on the Swiss Franc due to its status as a safe-haven currency.
วันนี้ดัชนี VIX อยู่ที่ 17.67 สะท้อนว่าตลาดยังไม่ได้อยู่ในภาวะ Risk-Off อย่างชัดเจน ส่งผลให้แรงหนุนต่อสินทรัพย์ปลอดภัยอย่าง CHF ยังมีจำกัดในระยะสั้น ขณะที่นักลงทุนยังคงเปิดรับความเสี่ยงในระดับปานกลาง สำหรับวันนี้ เวลา 13:30 น. ติดตามการประกาศดัชนี PPI รายเดือนของสวิตเซอร์แลนด์ ซึ่งตลาดคาดการณ์ที่ 0.4% จากครั้งก่อน 0.8% รวมถึงดัชนีความเชื่อมั่นผู้บริโภค SECO ที่คาดว่าจะปรับตัวดีขึ้นสู่ระดับ -38 จากครั้งก่อน -40 สะท้อนมุมมองต่อเศรษฐกิจภายในประเทศที่เริ่มฟื้นตัว หากตัวเลขออกมาดีกว่าคาด อาจช่วยสนับสนุนค่าเงิน CHF และหนุน CHFTHB ได้ในระยะสั้น ในส่วนด้านปัจจัยภูมิรัฐศาสตร์ สหรัฐฯ และอิหร่านสามารถบรรลุข้อตกลงสันติภาพได้ อาจทำให้ตลาดเปิดรับความเสี่ยง (Risk On) ซึ่งอาจกดดัน CHF ในฐานะสกุลเงินปลอดภัย
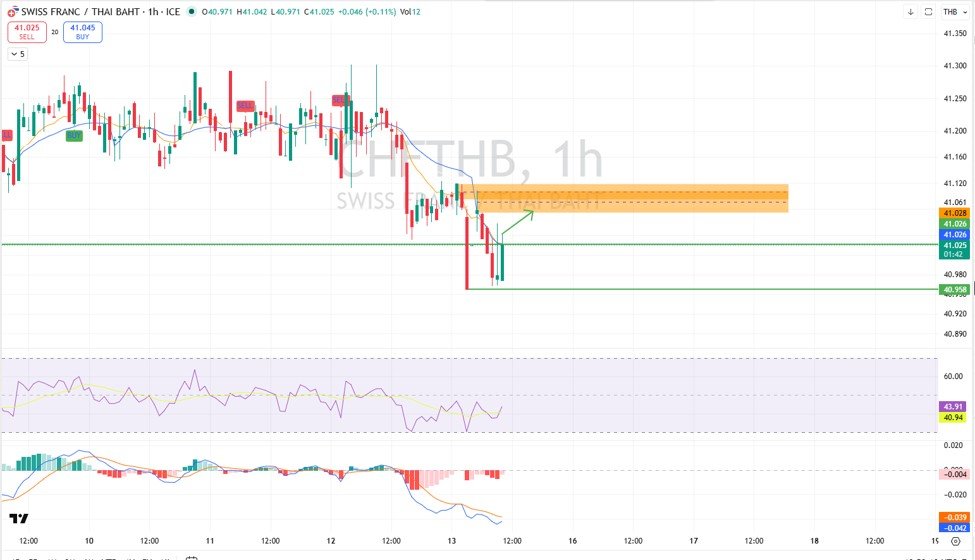
Technical Outlook: On the 4-hour timeframe (4H), the macro structure of CHFTHB shows a downtrend, trading below both short- and medium-term EMAs following a breach of key support. Nevertheless, notable buying pressure has returned around the 40.95 – 40.96 support zone, forming a reversal candle structure and pushing the price back above 41.00. The RSI has rebounded from lower levels and is now hovering above 40, indicating a deceleration in selling momentum. The MACD remains negative, but a contracting histogram suggests that the downward momentum is waning. If the price can consistently hold above 41.03, a technical rebound is expected to test the key resistance cluster at 41.08 – 41.11, where supply has previously accumulated.
ภาพรวมกราฟ CHFTHB ใน Time Frame 4H มีลักษณะเป็นเทรนด์ขาลง หลังราคาหลุดแนวรับสำคัญและเคลื่อนไหวต่ำกว่าเส้น EMA ทั้งระยะสั้นและระยะกลาง อย่างไรก็ตาม บริเวณแนวรับ 40.95 – 40.96 เริ่มมีแรงซื้อกลับเข้ามาอย่างชัดเจน ส่งผลให้เกิดแท่งเทียนกลับตัวและดันราคาฟื้นขึ้นมายืนเหนือ 41.00 ได้อีกครั้ง ขณะที่ RSI ปรับตัวขึ้นจากโซนต่ำและเริ่มเคลื่อนไหวเหนือระดับ 40 สะท้อนว่าแรงขายเริ่มชะลอลง ด้าน MACD ยังคงอยู่ในแดนลบ แต่ Histogram เริ่มหดตัว บ่งชี้ว่าโมเมนตัมขาลงเริ่มอ่อนกำลัง หากราคาสามารถยืนเหนือบริเวณ 41.03 ได้อย่างต่อเนื่อง มีโอกาสเกิด Technical Rebound ขึ้นไปทดสอบแนวต้านบริเวณ 41.08 – 41.11 ซึ่งเป็นโซนแนวต้านสำคัญและเป็นบริเวณที่มีแรงขายสะสมอยู่ก่อนหน้า
- Support Level (แนวรับ): 40.97
- Target (เป้าหมาย): 41.08 – 41.11
- Stop Loss (คัท): 40.94
https://th.tradingview.com/u/Soponwit_AISA_MSc/