

USDTHB
Market Analysis: The US Dollar received strong support from higher-than-expected US PPI data (Monthly PPI at 1.1% vs 0.7% expected, Annual PPI at 6.5% vs 6.4% expected), reflecting persistent inflationary pressures. This scaled back market expectations for Fed rate cuts and boosted the greenback. Geopolitical tensions also spurred safe-haven demand overnight after President Trump signaled potential strikes on Iran’s Kharg Island,
though he later canceled the plans citing progress in negotiations, causing gold to surge and temporarily cooling the USD. Investors now await tonight’s Michigan Consumer Sentiment index (expected at 46.6 vs 44.8 previously) and MI inflation expectations (4.8%); stronger data could lift Bond Yields and the USD, while weaker figures might spark short-term profit-taking.
ดอลลาร์สหรัฐได้รับแรงหนุนจากตัวเลข PPI ที่สูงกว่าคาด (รายเดือน 1.1% vs คาด 0.7%, รายปี 6.5% vs คาด 6.4%) สะท้อนเงินเฟ้อที่ยังทรงตัวในระดับสูง ส่งผลให้นักลงทุนลดความหวังต่อการลดดอกเบี้ยของ Fed และหนุน USD แข็งค่าขึ้น ขณะที่ความตึงเครียดทางภูมิรัฐศาสตร์จากสัญญาณของปธน. ทรัมป์เรื่องการโจมตีเกาะคาร์กของอิหร่านช่วยหนุนสินทรัพย์ปลอดภัยในคืนก่อนหน้า แม้ภายหลังจะยกเลิกแผนเพราะการเจรจาคืบหน้าจนดันทองคำพุ่งและกดดัน USD ลงบ้าง สำหรับคืนนี้ ตลาดจับตาดัชนีความเชื่อมั่นผู้บริโภครัฐมิชิแกน (คาด 46.6 vs เดิม 44.8) และคาดการณ์เงินเฟ้อ MI (4.8%) หากตัวเลขออกมาดีจะช่วยหนุน Bond Yield และ USD ต่อ แต่หากอ่อนแออาจเกิดแรงขายทำกำไรในระยะสั้น
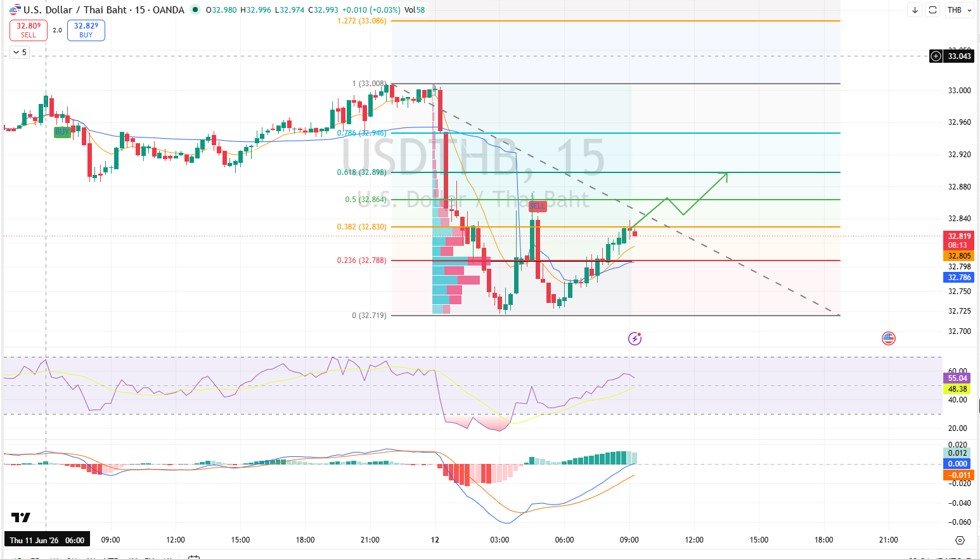
Technical Outlook: Following heavy selling pressure, buy momentum has turned positive after the price bounced from the Fib 0% level (32.719) and reclaimed its position above the EMA. The RSI has crossed above 50, and the MACD has formed a bullish crossover with the Histogram entering positive territory, indicating returning buying pressure. However, the price remains below the key resistance zone of Fib 0.5 – 0.618 (32.864 – 32.898), suggesting this move is still a technical rebound within a range rather than a full trend reversal. If the price breaks above 32.83 and sustains above 32.86, it has the potential to test the next resistance targets.
หลังจากเกิดแรงขายหนัก โมเมนตัมฝั่ง Buy เริ่มกลับมาเป็นบวกหลังราคาดีดตัวจาก Fib 0% (32.719) และกลับขึ้นมายืนเหนือเส้น EMA ได้ ขณะที่ RSI เหนือ 50 และ MACD ตัดขึ้นพร้อม Histogram ในแดนบวก สะท้อนแรงซื้อที่เริ่มกลับเข้ามา อย่างไรก็ตาม ราคายังอยู่ใต้โซนแนวต้านสำคัญ Fib 0.5 – 0.618 (32.864 – 32.898) จึงยังเป็นเพียงการรีบาวด์ในกรอบ หากผ่าน 32.83 และยืนเหนือ 32.86 ได้ มีลุ้นปรับตัวขึ้นทดสอบแนวต้านถัดไป
Support Level (แนวรับ): 32.79 – 32.78 Target (เป้าหมาย): 32.89 – 32.94 Stop Loss (คัท): 32.76
EURTHB
Market Analysis: The Euro found support after the ECB hiked its policy rate to 2.40% and deposit rate to 2.25% in its latest meeting, underscoring its commitment to curbing inflation. Consequently, EURTHB is expected to trade with high volatility but maintains a slightly positive bias in the short term due to the hawkish ECB outlook. However, the Baht continues to be supported by regional fundamentals in Asia, which could cap the Euro’s upside potential. Traders should closely monitor global risk sentiment and the direction of the US Dollar.
เงินยูโรได้รับแรงหนุนหลัง ECB ปรับขึ้นดอกเบี้ยนโยบายสู่ 2.40% และดอกเบี้ยเงินฝากสู่ 2.25% สะท้อนท่าทีเข้มงวดในการคุมเงินเฟ้อ ส่งผลให้ EURTHB มีแนวโน้มเคลื่อนไหวผันผวนแต่ยังมีน้ำหนักเชิงบวกเล็กน้อยในระยะสั้น อย่างไรก็ดี ค่าเงินบาทยังคงมีปัจจัยหนุนจากพื้นฐานในภูมิภาคเอเชีย ซึ่งอาจทำให้กรอบการแข็งค่าของ EURTHB ถูกจำกัด จึงต้องติดตามทิศทาง USD และภาวะ Risk Sentiment อย่างใกล้ชิด
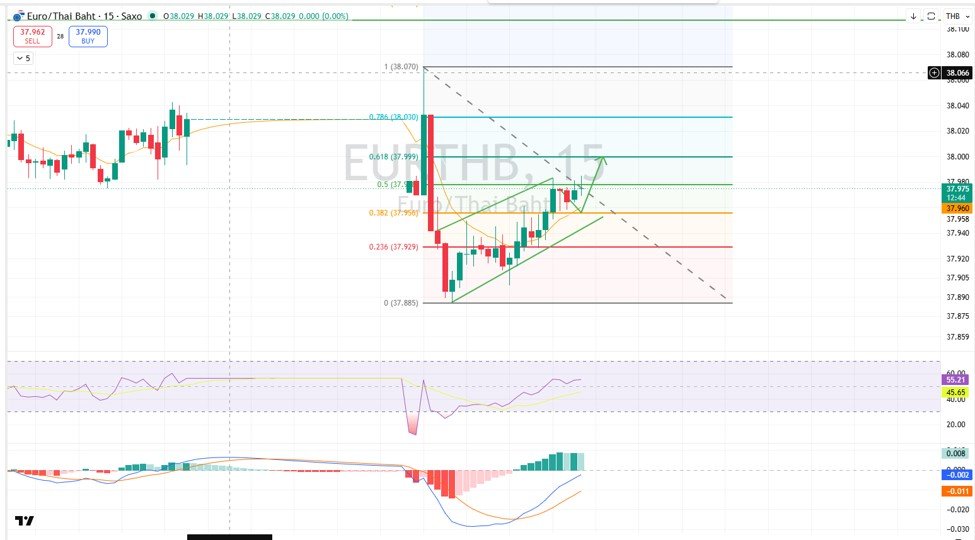
Technical Outlook: The overall picture on the 4-hour (4H) timeframe shows a sideways pattern, but short-term signs of recovery are emerging as the price consistently holds above its short-term uptrend line. The price rebounded from the Fib 0% level at 37.885 and managed to reclaim the Fib 0.5 level at 37.971. Furthermore, the RSI has moved above 50 and the MACD has crossed upward with a positive Histogram, confirming renewed buying interest. If the price can stabilize above the 37.97 support, it has an opportunity to test higher Fibonacci resistance levels.
ภาพรวมใน TF 4H ยังคงเป็นลักษณะ Side-way แต่ระยะสั้นเริ่มฟื้นตัวหลังยืนเหนือเส้นแนวโน้มขาขึ้นระยะสั้นได้ต่อเนื่อง โดยดีดตัวจาก Fib 0% (37.885) กลับขึ้นมายืนเหนือ Fib 0.5 (37.971) ได้สำเร็จ ขณะที่ RSI เหนือ 50 และ MACD ตัดขึ้นในแดนบวกแสดงถึงแรงซื้อที่กลับเข้ามา หากรักษาระดับเหนือแนวรับ 37.97 ได้ มีโอกาสขึ้นทดสอบแนวต้านถัดไปที่ Fib 0.618 และ Fib 0.786
Support Level (แนวรับ): 37.96 – 37.93 Target (เป้าหมาย): 37.99 – 38.03 Stop Loss (คัท): 37.92
AUDTHB
Market Analysis: The Australian Dollar was bolstered by June’s MI inflation expectations pointing to 5.5%. Although slightly lower than the previous 5.6%, the figure remains elevated, likely prompting the RBA to maintain its hawkish monetary policy stance. Additionally, energy supply anxieties in the Middle East have supported commodity prices, providing a tailwind for the AUD. Nevertheless, any continued strengthening of the USD from US economic data could act as a near-term headwind for AUDTHB.
ดอลลาร์ออสเตรเลียได้รับแรงหนุนจากคาดการณ์เงินเฟ้อเดือนมิถุนายนจากสถาบัน MI ที่ระดับ 5.5% แม้ชะลอลงจากเดือนก่อนเล็กน้อยแต่ยังอยู่ในระดับสูง ซึ่งอาจทำให้ RBA ยังคงจุดยืนนโยบายการเงินที่เข้มงวด นอกจากนี้ราคาสินค้าโภคภัณฑ์ยังได้อานิสงส์จากความกังวลด้านอุปทานพลังงานในตะวันออกกลาง อย่างไรก็ตาม หาก USD ยังแข็งค่าต่อเนื่องจากข้อมูลเศรษฐกิจสหรัฐฯ ก็อาจเป็นปัจจัยสกัดช่วงขาขึ้นของ AUDTHB ในระยะสั้น
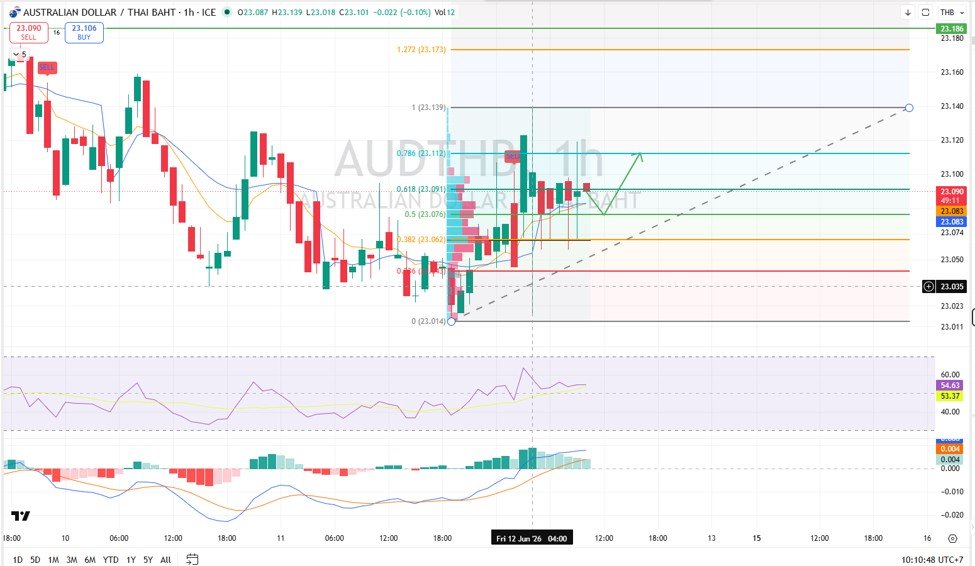
Technical Outlook: While the broader trend on the 4H timeframe remains a downtrend, short-term price action has successfully held above the EMA line and is currently consolidating above the Fib 0.5 level at 23.076. The RSI has pushed above 50 but has not yet reached overbought territory. The MACD remains above its signal line in positive territory, although the Histogram shows signs of decelerating momentum. This indicates that buyers still hold an advantage in the near term, and maintaining a position above 23.08 could clear the path for a test of immediate resistance zones.
แม้เทรนด์หลักใน TF 4H จะเป็นขาลง แต่ระยะสั้นราคาสามารถยืนเหนือเส้น EMA ได้ต่อเนื่องและแกว่งตัวเหนือ Fib 0.5 (23.076) ขณะที่ RSI อยู่เหนือ 50 และยังไม่ Overbought ส่วน MACD อยู่ในแดนบวกเหนือเส้น Signal แม้ Histogram จะชะลอความร้อนแรงลงบ้าง แต่สะท้อนว่าฝั่งซื้อยังได้เปรียบในระยะสั้น หากยืนเหนือ 23.08 ได้ มีโอกาสขึ้นทดสอบแนวต้านถัดไป
Support Level (แนวรับ): 23.07 – 23.06 Target (เป้าหมาย): 23.11 – 23.14 Stop Loss (คัท): 23.05
GBPTHB
Market Analysis: Today at 13:00, watch for the UK’s monthly GDP data for April, which is forecasted to contract by -0.1% (down from the previous 0.3% expansion), signaling an economic slowdown. Additionally, the Manufacturing Production MoM is expected at -0.2%, reflecting a slight cooling in production. If the actual data misses expectations, it could pressure the GBP in the short term. However, the overall direction of GBPTHB remains heavily dependent on USD movements.
วันนี้เวลา 13.00 น. ติดตามตัวเลข GDP รายเดือนเมษายนของอังกฤษ คาดการณ์หดตัว -0.1% จากเดือนก่อนที่ขยายตัว 0.3% สะท้อนการชะลอตัวของเศรษฐกิจ ขณะที่ดัชนีผลผลิตอุตสาหกรรมรายเดือนคาดการณ์ที่ -0.2 % สะท้อนภาคการผลิตเริ่มชะลอตัวลงเล็กน้อย หากตัวเลขออกมาต่ำกว่าคาด อาจกดดัน GBP ในระยะสั้น โดยทิศทาง GBPTHB ยังคงขึ้นอยู่กับการเคลื่อนไหวของ USD เป็นสำคัญ
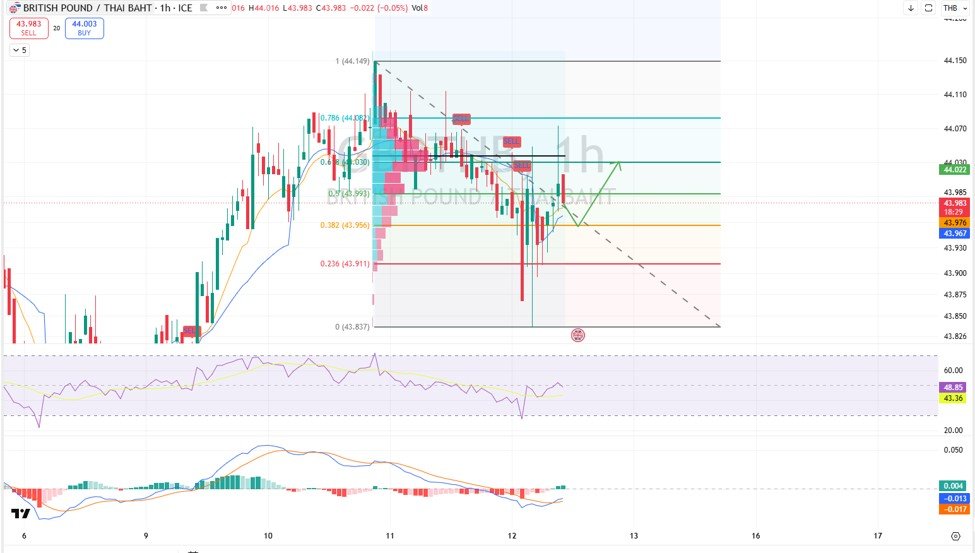
Technical Outlook: On the 4-hour timeframe (4H), the overall chart exhibits a “Sideway Up” pattern. In the short term, recovery signals are emerging after the price successfully broke above the short-term downtrend line and reclaimed the Fib 0.382 level at 43.956, indicating fading selling pressure. The price is currently trading above the EMA. Meanwhile, the RSI is rebounding from lower levels and moving close to 50, showing returning buying momentum, while the MACD features a bullish crossover with the Histogram shifting into positive territory. If the price can sustain above 43.99, it has a good chance to test the immediate resistance target at 44.03 – 44.08.
ภาพรวมกราฟ Time Frame 4H มีลักษณะเป็น Sideway Up โดยในระยะสั้นเริ่มมีสัญญาณฟื้นตัวหลังราคาสามารถทะลุเส้นแนวโน้มขาลงระยะสั้นขึ้นมาได้ และกลับมายืนเหนือบริเวณ Fib 0.382 ที่ 43.956 ได้อีกครั้ง สะท้อนว่าแรงขายเริ่มชะลอตัวลง ขณะที่ราคาเคลื่อนไหวอยู่เหนือเส้น EMA ด้าน RSI ปรับตัวขึ้นจากระดับต่ำและเคลื่อนไหวใกล้ระดับ 50 สะท้อนว่าแรงซื้อเริ่มกลับเข้ามาในตลาด สอดคล้องกับ MACD ที่มีสัญญาณตัดขึ้นและ Histogram กลับมาอยู่ในแดนบวก บ่งชี้ว่าโมเมนตัมขาลงเริ่มอ่อนแรง หากราคาสามารถยืนเหนือ 43.99 ได้ มีโอกาสปรับตัวขึ้นทดสอบแนวต้านระยะสั้นต่อไป
Risk Analysis: Despite the initial recovery, the price is still moving within a consolidation zone and remains below the key resistance area of Fib 0.618 – 0.786 ($44.03 – 44.08$), where substantial selling pressure is clustered. Failure to break above this zone could trigger profit-taking, pulling the price back down to test the support at 43.96 – 43.93. Furthermore, since the RSI is still slightly below the 50 level, buying power isn’t fully robust yet, meaning traders should remain cautious of continued sideway fluctuations.
แม้ราคาจะเริ่มฟื้นตัว แต่ยังคงเคลื่อนไหวอยู่ภายในโซนสะสมตัวและต่ำกว่าแนวต้านสำคัญบริเวณ Fib 0.618 – 0.786 ที่ 44.03 – 44.08 ซึ่งเป็นบริเวณที่มีแรงขายสะสมอยู่พอสมควร หากไม่สามารถผ่านโซนดังกล่าวได้ อาจเกิดแรงขายทำกำไรและกดดันให้ราคาย่อตัวกลับลงมาทดสอบแนวรับอีกครั้ง นอกจากนี้ RSI ยังอยู่ต่ำกว่าระดับ 50 เล็กน้อย ทำให้แรงซื้อยังไม่แข็งแกร่งมากนัก จึงต้องระวังการแกว่งตัวในกรอบ Sideway ต่อไป
Support Level (แนวรับ): 43.96 – 43.93
Target (เป้าหมาย): 44.03 – 44.08
Stop Loss (คัท): 43.91
CHFTHB
Market Analysis: The CHF continues to be supported by its safe-haven status amid global economic uncertainty and geopolitical tensions in the Middle East. Meanwhile, the market is still assessing the impact of high US inflation. If tonight’s US Consumer Sentiment data misses expectations, it could trigger additional safe-haven buying and further strengthen the CHF.
CHF ยังคงได้รับแรงหนุนจากสถานะสินทรัพย์ปลอดภัย ท่ามกลางความไม่แน่นอนของเศรษฐกิจโลกและความตึงเครียดทางภูมิรัฐศาสตร์ในตะวันออกกลาง ขณะที่ตลาดยังคงประเมินผลกระทบจากเงินเฟ้อสหรัฐฯ ที่อยู่ในระดับสูง หากตัวเลขความเชื่อมั่นผู้บริโภคสหรัฐฯ คืนนี้ออกมาต่ำกว่าคาด อาจกระตุ้นแรงซื้อสินทรัพย์ปลอดภัยเพิ่มเติมและหนุน CHF ให้แข็งค่าขึ้น
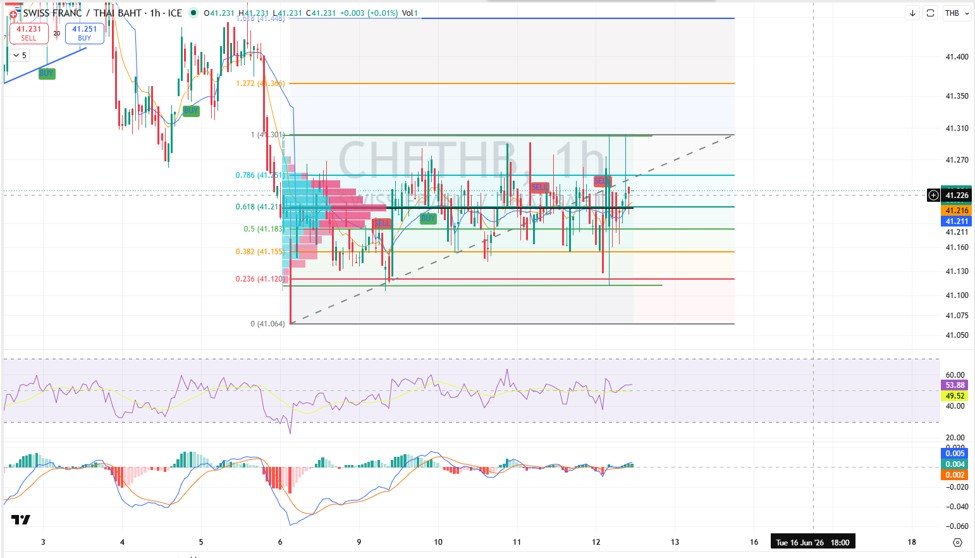
Technical Outlook: On the 4-hour timeframe (4H), the overall trend is moving in a Sideway Down characteristic, while in the short term, the price is consolidating within a Fibonacci range. The price has managed to consistently hold above key support levels at Fib 0.5 (41.183) and Fib 0.618 (41.201). Meanwhile, the RSI has climbed above 50 with a positive bias, and the MACD has crossed above the Signal line with the Histogram returning to positive territory. This indicates weakening selling pressure and potential short-term recovery. If the price can sustain above 41.22, it has a chance to test the resistance zone at 41.25 – 41.30, which aligns with the Fib 0.786 level and the peak of the consolidation range. However, upside momentum remains limited as the price is still within the accumulation zone, and the MACD is close to the zero line. Failure to break the resistance could trigger profit-taking, sending the price back to retest the 41.18 support.
ในทางเทคนิค ภาพรวมกราฟใน TF 4H เคลื่อนไหวในลักษณะ Sideway Down โดยในระยะสั้น ราคาเคลื่อนไหวลักษณะ Sideway ภายในกรอบ Fibonacci โดยราคาสามารถยืนเหนือแนวรับสำคัญบริเวณ Fib 0.5 ที่ 41.183 และ Fib 0.618 ที่ 41.201 ได้อย่างต่อเนื่อง ขณะที่ RSI ปรับตัวขึ้นเหนือระดับ 50 และเริ่มมีทิศทางเป็นบวก ส่วน MACD ตัดขึ้นเหนือเส้น Signal และ Histogram กลับมาอยู่ในแดนบวก สะท้อนว่าแรงขายเริ่มอ่อนตัวลงและมีโอกาสเห็นการฟื้นตัวในระยะสั้น หากราคาสามารถยืนเหนือ 41.22 ได้ มีโอกาสปรับตัวขึ้นทดสอบแนวต้านบริเวณ 41.25 – 41.30 ซึ่งเป็นโซน Fib 0.786 และจุดสูงสุดของกรอบสะสมตัว อย่างไรก็ตาม โมเมนตัมขาขึ้นยังไม่แข็งแกร่งมากนักเนื่องจาก MACD ยังอยู่ใกล้เส้นศูนย์ หากไม่สามารถทะลุผ่านแนวต้านดังกล่าวได้อย่างชัดเจน อาจเกิดแรงขายทำกำไรและกดดันให้ราคาย่อตัวกลับลงมาทดสอบแนวรับเดิม
Support Level (แนวรับ): 41.18 Target (เป้าหมาย): 41.25 – 41.30 Stop Loss (คัท): 41.17
https://th.tradingview.com/u/Soponwit_AISA_MSc/