
USDTHB
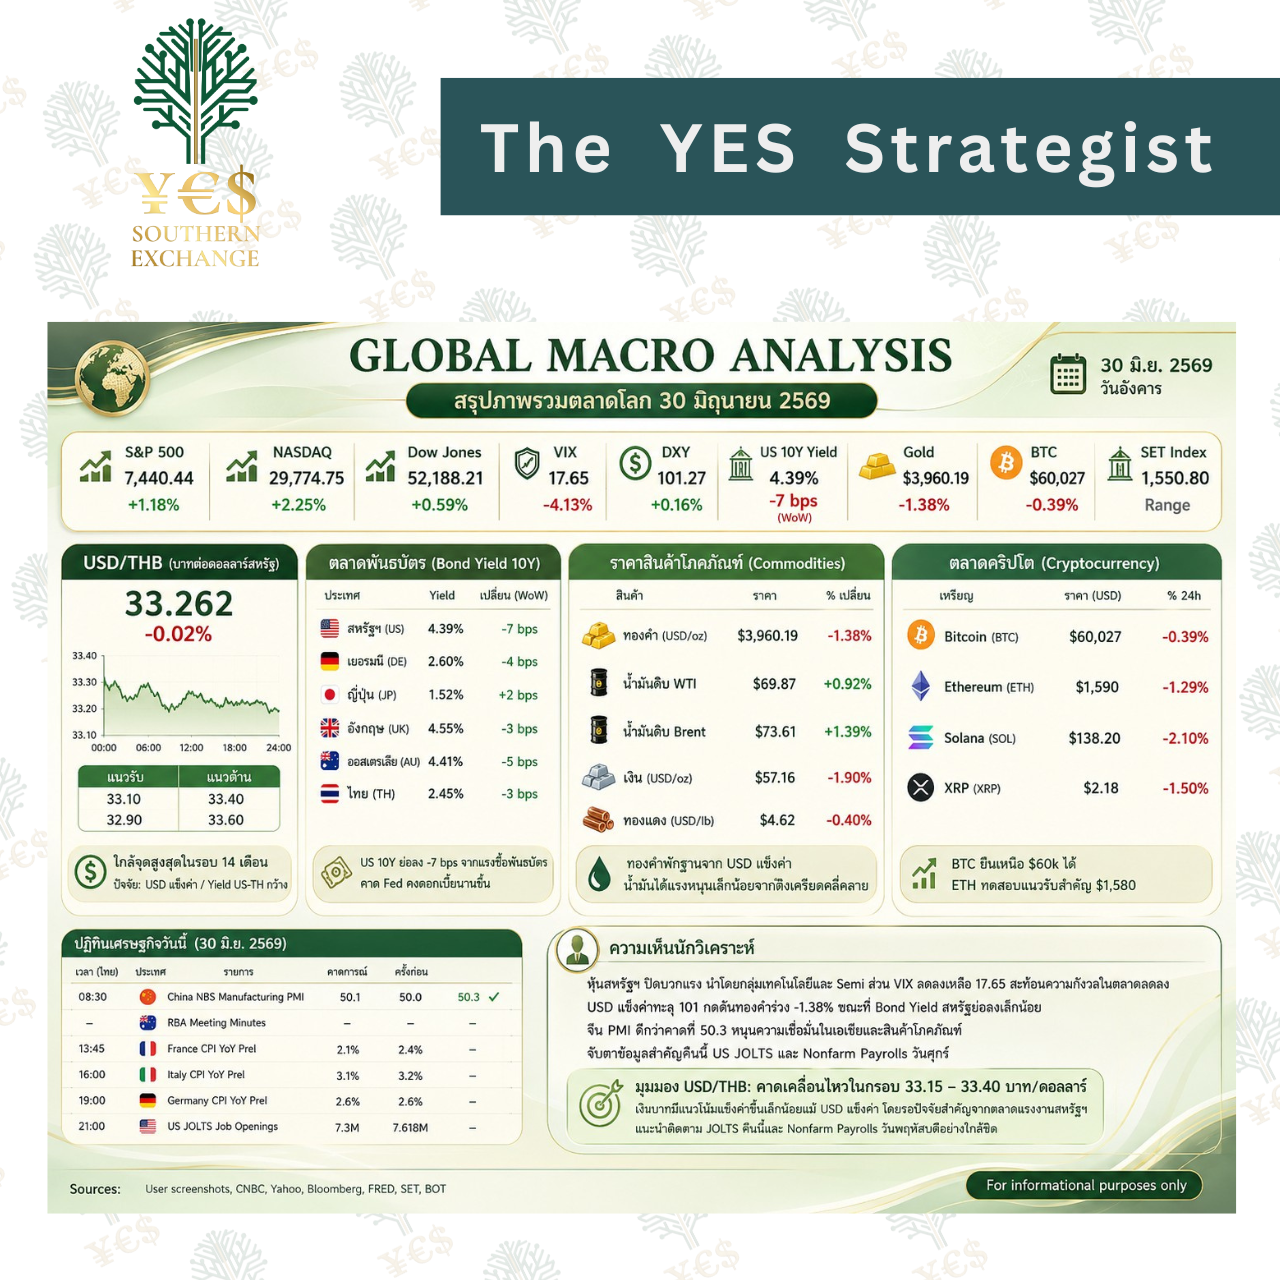
Market Analysis: The DXY index rose to 101.27, reflecting support for the USD, while gold prices weakened. This keeps USDTHB stable to slightly stronger. Tonight at 21:00, the market is monitoring the May JOLTS Job Openings, expected to fall to 7.280M from 7.618M, signaling a cooling US labor market.
Concurrently, the CB Consumer Confidence index is expected to rise to 94.2 from 93.1. If both figures beat expectations, it could provide a short-term boost to the Greenback.
วิเคราะห์ตลาด: ดัชนี DXY ปรับตัวขึ้นสู่ระดับ 101.27 สะท้อนแรงหนุนของ USD ขณะที่ทองคำอ่อนค่า ส่งผลให้ USDTHB มีแนวโน้มทรงตัวและแข็งค่าเล็กน้อย โดยคืนนี้เวลา 21.00 ตลาดจับตาตำแหน่งงานว่างเปิดใหม่จาก JOLTS เดือนพฤษภาคม ซึ่งคาดว่าจะลดลงสู่ 7.280M จาก 7.618M สะท้อนการชะลอตัวของตลาดแรงงานสหรัฐฯ ขณะเดียวกันยังติดตามดัชนีความเชื่อมั่นผู้บริโภค (CB Consumer Confidence) ซึ่งคาดว่าจะปรับตัวขึ้นสู่ 94.2 จาก 93.1 หากตัวเลขทั้งสองออกมาดีกว่าคาด อาจช่วยหนุนค่าเงินดอลลาร์ได้ในระยะสั้น
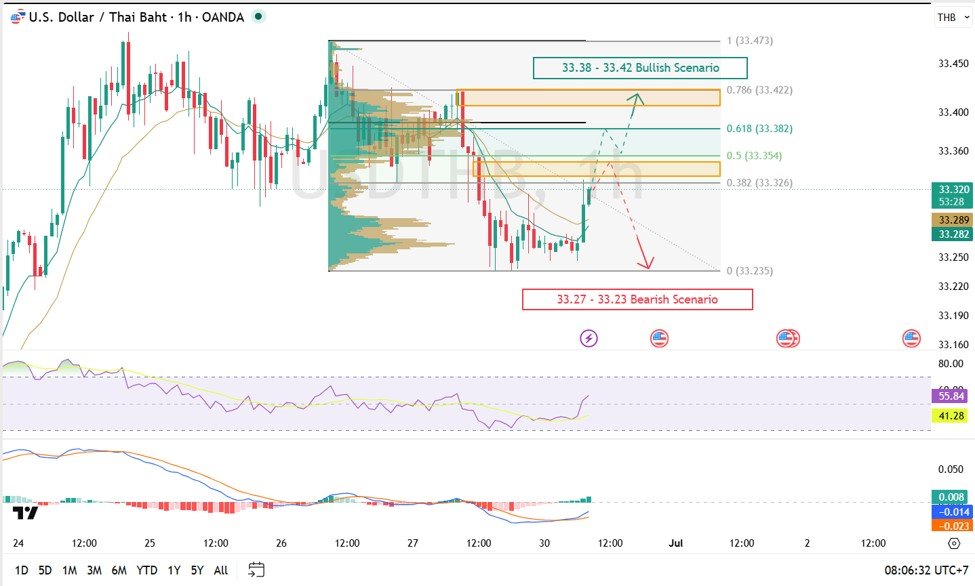
Technical Outlook: The overall USDTHB chart has turned positive after rebounding from the 33.24–33.27 support zone and reclaiming its position above the EMA lines. Price is now approaching a key resistance zone at 33.32–33.33 (Fibonacci 0.382), a critical juncture that will determine if this rebound evolves into a sustained uptrend. The RSI has moved above 55, indicating growing buying momentum, while the MACD has crossed above the Signal line with a positive Histogram, showing buyers are regaining control. However, failure to break the 33.32–33.38 resistance area (Fibonacci, FVG, and old supply zone) could trigger short-term profit-taking. A drop below 33.29 and 33.25 would turn the short-term outlook bearish, with potential pressure from a positive opening in the Thai stock market.
แนวโน้มเทคนิค: ภาพรวมกราฟ USDTHB เริ่มกลับมาเป็นบวกหลังจากราคาดีดตัวขึ้นจากโซนแนวรับบริเวณ 33.24–33.27 และยืนเหนือเส้น EMA ได้ โดยราคากำลังทดสอบโซนแนวต้านสำคัญ 33.32–33.33 (Fibonacci 0.382) ซึ่งเป็นจุดชี้วัดว่าการรีบาวด์นี้จะพัฒนาเป็นขาขึ้นได้หรือไม่ อีกทั้ง RSI ปรับขึ้นเหนือ 55 สะท้อนโมเมนตัมฝั่งซื้อที่แข็งแกร่ง และ MACD ตัดขึ้นเหนือเส้น Signal เป็นบวก อย่างไรก็ตาม หากไม่สามารถผ่านโซน 33.32–33.38 (แนวต้าน Fibo และ FVG) อาจเกิดแรงขายทำกำไรระยะสั้น นอกจากนี้ หากราคาหลุดต่ำกว่า 33.29 และ 33.25 จะทำให้ภาพระยะสั้นกลับเป็นลบ และอาจถูกกดดันเพิ่มเติมหากตลาดหุ้นไทยช่วงเช้าเปิดบวก
- Support Level (แนวรับ): 33.27 – 33.23
- Target (เป้าหมาย): 33.38 – 33.42
- Stop Loss (คัท): 33.22
EURTHB
Market Analysis: EURTHB is expected to move within a stable to slightly stronger range. Tonight at 19:00, markets await Germany’s June CPI (YoY), projected to slow to 2.5% from 2.6%, while the MoM figure is expected to rise by 0.1% from -0.2%. Investors are also waiting for speeches from ECB officials to gauge future monetary policy; any hawkish signals to keep interest rates elevated for longer could support the Euro.
วิเคราะห์ตลาด: EURTHB มีแนวโน้มเคลื่อนไหวในกรอบทรงตัวถึงแข็งค่าเล็กน้อย โดยคืนนี้เวลา 19.00 ตลาดติดตามดัชนี CPI ของเยอรมนี (YoY) เดือนมิถุนายน คาดว่าจะชะลอลงสู่ 2.5% จาก 2.6% และ CPI (MoM) คาดเพิ่มขึ้น 0.1% จาก -0.2% นอกจากนี้ นักลงทุนรอฟังถ้อยแถลงเจ้าหน้าที่ ECB เพื่อประเมินทิศทางนโยบายการเงิน หากมีการส่งสัญญาณคงดอกเบี้ยในระดับสูงนานกว่าคาด อาจเป็นปัจจัยหนุนค่าเงิน EUR
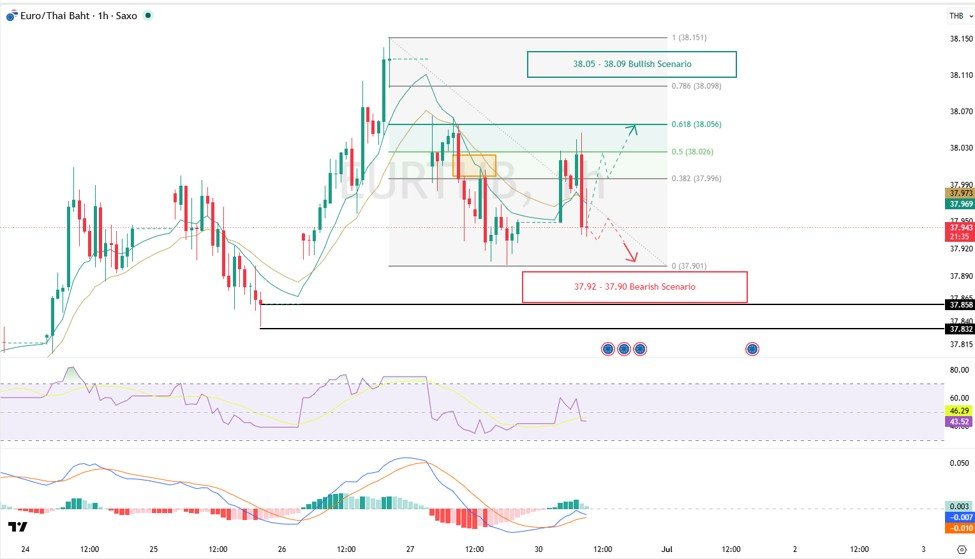
Technical Outlook: The overall EURTHB chart continues to move in a “Sideway Up” pattern. Despite facing selling pressure from the 38.02 level, the price successfully maintained its base above the key support at 37.92, keeping the short-term structure intact. The RSI sits at 43, indicating a slowdown in downward momentum despite being below 50, and the MACD Histogram is shrinking within negative territory. While short-term momentum remains soft and a clear reversal signal is pending, a recovery above 38.00–38.03 could reopen the path to retest the 38.05–38.09 resistance zone. A break below 37.92 would be a negative signal, potentially aggravated if the Thai stock market opens in positive territory.
แนวโน้มเทคนิค: ภาพรวมกราฟ EURTHB ยังคงเคลื่อนไหวในลักษณะ Sideway Up แม้มีแรงขายกดลงจากบริเวณ 38.02 แต่ราคายังรักษาฐานเหนือแนวรับสำคัญ 37.92 ได้ โครงสร้างระยะสั้นจึงยังไม่เสีย โดย RSI อยู่ที่ 43 เริ่มชะลอการอ่อนตัว และ MACD Histogram เริ่มหดตัวจากฝั่งลบ บ่งชี้แรงขายที่อ่อนลง แม้โมเมนตัมระยะสั้นยังค่อนข้างอ่อนแรง แต่หากราคาสามารถกลับมายืนเหนือ 38.00–38.03 ได้ จะมีโอกาสฟื้นตัวขึ้นทดสอบแนวต้าน 38.05–38.09 อีกครั้ง ในทางกลับกัน หากราคาหลุดแนวรับ 37.92 จะเป็นสัญญาณลบต่อโครงสร้างราคา และอาจถูกกดดันเพิ่มหากตลาดหุ้นไทยช่วงเช้าเปิดบวก
- Support Level (แนวรับ): 37.92 – 37.90
- Target (เป้าหมาย): 38.05 – 38.09
- Stop Loss (คัท): 37.89
GBPTHB
Market Analysis: GBPTHB is likely to trade sideways today. At 13:00, the market will monitor the UK’s Q1 GDP, which is expected to hold steady at 0.6% QoQ and 1.1% YoY. However, the Current Account deficit is projected to widen to -21.5B from -18.4B. Economic data beating estimates could support the Pound. Furthermore, a speech by BoE’s Sarah Breeden at 17:40 will be closely watched; any hawkish undertones may boost GBP in the short term.
วิเคราะห์ตลาด: GBPTHB มีแนวโน้มเคลื่อนไหวทรงตัว โดยวันนี้เวลา 13.00 ตลาดติดตาม GDP ไตรมาส 1 ของสหราชอาณาจักร คาดว่าจะขยายตัว 0.6% QoQ และ 1.1% YoY เท่าครั้งก่อน ขณะที่บัญชีเดินสะพัดคาดขาดดุลเพิ่มเป็น -21.5B จาก -18.4B หากข้อมูลเศรษฐกิจออกมาดีกว่าคาด อาจช่วยหนุน GBP เพิ่มเติม นอกจากนี้ เวลา 17.40 ต้องติดตามการแถลงของนาง Sarah Breeden แห่ง BoE หากมีสัญญาณเชิง Hawkish อาจเป็นปัจจัยหนุนค่าเงิน GBP ในระยะสั้น
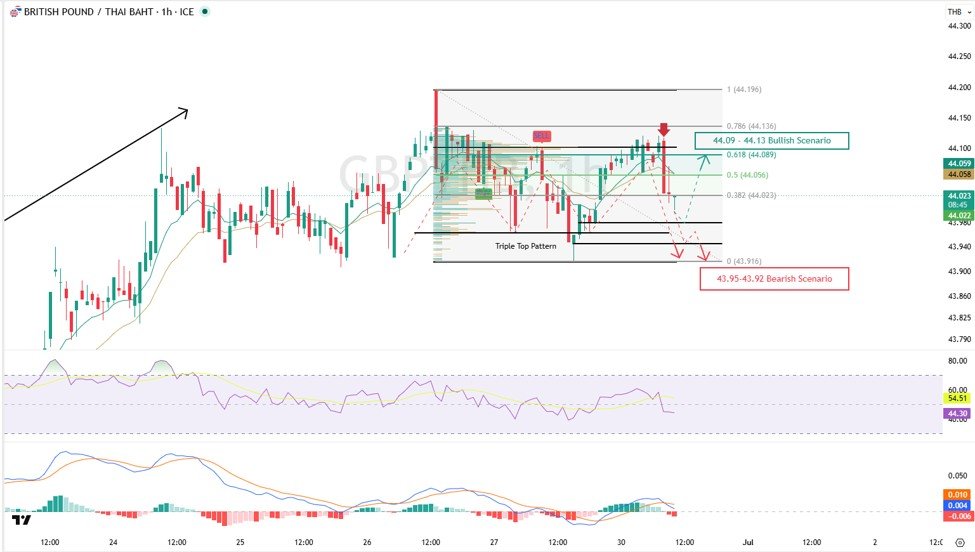
Technical Outlook: The GBPTHB chart is showing signs of weakness after forming a significant Triple Top Pattern at the 44.11–44.13 resistance zone. A swift wave of selling pressure forced the price below the minor support at 44.09, handing short-term control back to the bears. With the RSI below 50 and the MACD issuing a sell signal, the bias remains bearish. If the price can hold above the crucial 43.98–43.96 support zone, a technical rebound could aim for 44.02–44.06 and eventually 44.09–44.13. However, breaking below 43.98 will expose the 43.95 level, with potential added pressure if the Thai stock market opens positive.
แนวโน้มเทคนิค: ภาพรวมกราฟ GBPTHB เริ่มส่งสัญญาณอ่อนตัวหลังสร้างรูปแบบ Triple Top Pattern บริเวณแนวต้าน 44.11–44.13 และถูกแรงขายกดลงจนหลุดแนวรับระยะสั้น 44.09 สะท้อนโมเมนตัมฝั่งขายที่กลับมาได้เปรียบ ประกอบกับ RSI ต่ำกว่า 50 และ MACD ส่งสัญญาณขายพร้อมกัน ภาพรวมจึงยังให้น้ำหนักฝั่ง Bearish หากราคาสามารถยืนเหนือโซน 43.98–43.96 ได้ มีโอกาสเกิด Technical Rebound กลับขึ้นไปทดสอบแนวต้าน 44.02–44.06 และ 44.09–44.13 ตามลำดับ แต่หากราคาหลุดแนวรับ 43.98 จะเปิดโอกาสให้ปรับตัวลงทดสอบ 43.95 และอาจโดนกดดันเพิ่มหากตลาดหุ้นไทยเปิดบวก
- Support Level (แนวรับ): 43.98 – 43.95
- Target (เป้าหมาย): 44.09 – 44.13
- Stop Loss (คัท): 43.93
AUDTHB
Market Analysis: AUDTHB has room for a short-term rebound after China’s June Manufacturing PMI came in at 50.3, beating the 50.1 consensus and reflecting a recovery in the Chinese economy (a key driver for the Aussie). Additionally, Australia’s Private Sector Credit expanded by 0.7%, higher than the expected 0.6%, offering further support. Nonetheless, the overall direction of the US Dollar remains the primary driver in the short term.
วิเคราะห์ตลาด: AUDTHB มีโอกาสรีบาวด์ในระยะสั้น หลังดัชนี PMI ภาคการผลิตของจีนเดือนมิถุนายนออกมาที่ 50.3 สูงกว่าคาดที่ 50.1 สะท้อนการฟื้นตัวของเศรษฐกิจจีนซึ่งเป็นปัจจัยบวกต่อค่าเงิน AUD ขณะที่สินเชื่อภาคเอกชนของออสเตรเลียขยายตัว 0.7% สูงกว่าคาดที่ 0.6% ช่วยหนุนค่าเงิน AUD เพิ่มเติม อย่างไรก็ตาม ตลาดยังคงติดตามทิศทาง USD เป็นปัจจัยสำคัญในระยะสั้น
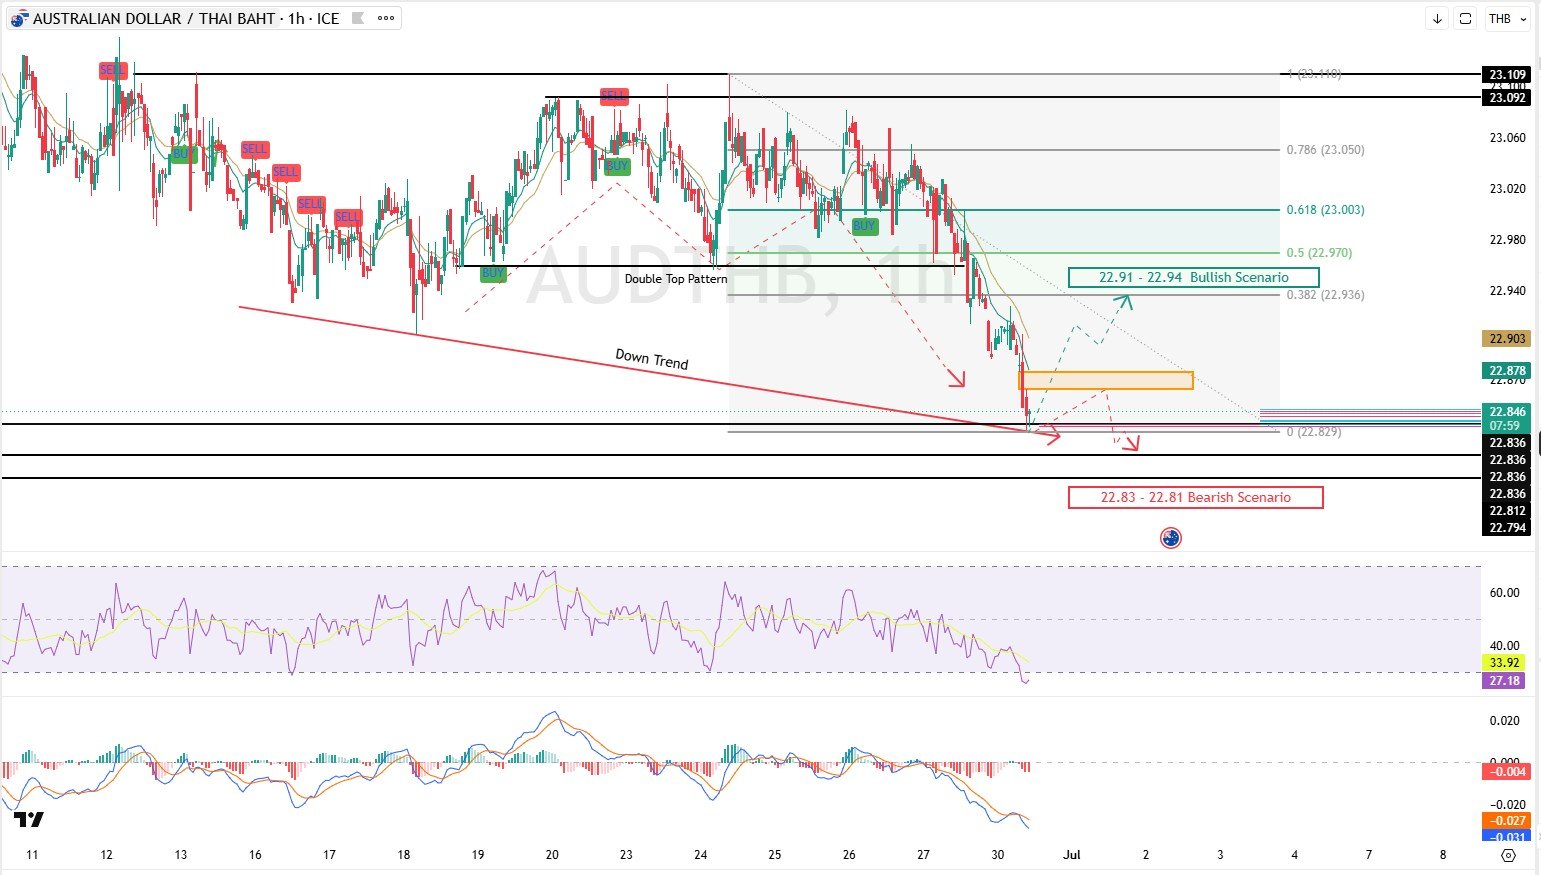
Technical Outlook: The primary trend for AUDTHB remains firmly within a Downtrend. Although a technical rebound has initiated from the key support at 22.83 due to oversold conditions, the market structure continues to print Lower Highs (LH) and Lower Lows (LL) below the EMA lines. The price is currently testing the 22.86–22.87 FVG resistance zone. Sustaining a breakout above this area could push the rebound toward the major short-term Fibonacci 0.382 resistance at 22.91–22.94. If it fails at the FVG zone, the price will likely slide back to test 22.84 and potentially 22.82–22.81, especially if the Thai stock market registers morning gains.
แนวโน้มเทคนิค: ภาพรวมกราฟ AUDTHB ยังอยู่ในแนวโน้มขาลง แม้เริ่มเกิดแรงรีบาวด์จากแนวรับสำคัญ 22.83 เนื่องจากภาวะ Oversold แต่โครงสร้างหลักยังเป็น Lower High และ Lower Low อีกทั้งราคาต่ำกว่าเส้น EMA การรีบาวด์รอบนี้จึงอาจเป็นเพียงการ Pullback ปัจจุบันราคากำลังทดสอบบริเวณ FVG แถว 22.86-22.87 หากยืนเหนือโซนนี้ได้ มีโอกาสรีบาวด์ขึ้นทดสอบโซน 22.91–22.94 (Fibonacci 0.382) แต่หากไม่ผ่านและมีแรงขายกลับมา มีโอกาสลงทดสอบแนวรับ 22.84 และ 22.82–22.81 ตามลำดับ ซึ่งหากตลาดหุ้นไทยช่วงเช้าเปิดบวก อาจกดดัน AUDTHB เพิ่มเติมได้
- Support Level (แนวรับ): 22.83 – 22.81
- Target (เป้าหมาย): 22.91 – 22.94
- Stop Loss (คัท): 22.78
CHFTHB
Market Analysis: CHFTHB is positioned to trade sideways to slightly weaker. At 14:00, Switzerland will release the KOF Leading Indicator for June, forecasted to rise to 99.4 from 98.0. A stronger reading could boost CHF briefly by showing economic resilience. However, the Swiss Franc remains vulnerable if global markets experience a “Risk-on” mood, capping safe-haven demand. Conversely, weaker-than-expected US economic metrics could trigger global growth fears and spark renewed safe-haven inflows into the Franc.
วิเคราะห์ตลาด: CHFTHB มีแนวโน้มเคลื่อนไหวทรงตัวถึงอ่อนค่าเล็กน้อย โดยวันนี้เวลา 14.00 ตลาดติดตามดัชนี KOF Leading Indicator ของสวิตเซอร์แลนด์ เดือนมิถุนายน คาดว่าจะปรับตัวขึ้นสู่ 99.4 จาก 98.0 ซึ่งหากตัวเลขออกมาดีกว่าคาดจะช่วยหนุน CHF ได้ในระยะสั้น อย่างไรก็ตาม ค่าเงิน CHF ยังถูกกดดันหากบรรยากาศการลงทุนอยู่ในโหมด Risk-on ซึ่งลดความต้องการสินทรัพย์ปลอดภัย แต่หากตัวเลขเศรษฐกิจสหรัฐฯ ออกมาย่ำแย่จนกระตุ้นความกังวลเศรษฐกิจโลก ก็อาจหนุนแรงซื้อ CHF ในฐานะ Safe Haven กลับมาอีกครั้ง
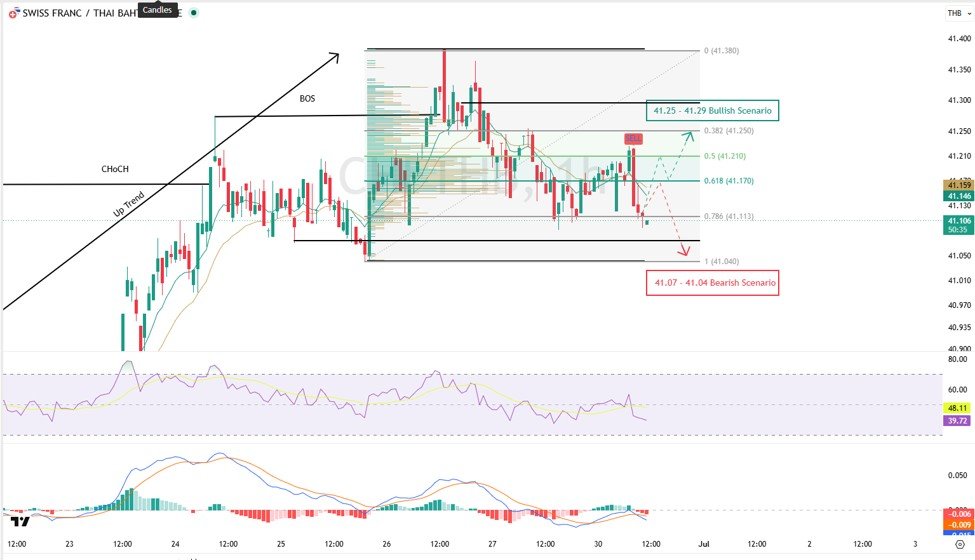
Technical Outlook: The CHFTHB price action is bound within a Sideways consolidation pattern. After failing to clear the 41.17–41.21 resistance, selling pressure forced the price down to the critical Fibonacci 0.786 support level at 41.11. While the macro structure is preserved, short-term momentum is waning with the RSI falling below 50 and the MACD printing a bearish signal. Holding above the 41.11–41.13 area could trigger a technical rebound back toward 41.17–41.21, and potentially 41.25–41.29 (especially if the Thai stock market drops in the afternoon). However, breaking below 41.07 will likely open the doors for a slide down to the range floor at 41.04, confirming a short-term bearish shift.
แนวโน้มเทคนิค: ภาพรวมกราฟ CHFTHB ยังคงเคลื่อนไหวในกรอบ Sideway หลังจากไม่สามารถผ่านแนวต้านบริเวณ 41.17–41.21 ได้ และเกิดแรงขายกลับลงมาที่โซน Fibonacci 0.786 (41.11) ซึ่งเป็นแนวรับสำคัญ แม้โครงสร้างใหญ่ยังไม่เสีย แต่โมเมนตัมระยะสั้นเริ่มอ่อนแรงลง (RSI < 50 และ MACD ส่งสัญญาณ Bearish) หากราคาสามารถยืนเหนือ 41.11–41.13 ได้ มีโอกาสเกิด Technical Rebound เพื่อทดสอบแนวต้าน 41.17 – 41.21 และมีลุ้นทดสอบ 41.25 – 41.29 (หากตลาดหุ้นไทยช่วงบ่ายเปิดลบ) แต่หากหลุด 41.07 จะเพิ่มโอกาสลงทดสอบฐานล่างของกรอบที่ 41.04 ซึ่งจะยืนยันการเปลี่ยนทิศทางเป็นขาลงในระยะสั้น
- Support Level (แนวรับ): 41.07 – 41.04
- Target (เป้าหมาย): 41.25 – 41.29
- Stop Loss (คัท): 41.02
https://th.tradingview.com/u/Soponwit_AISA_MSc/